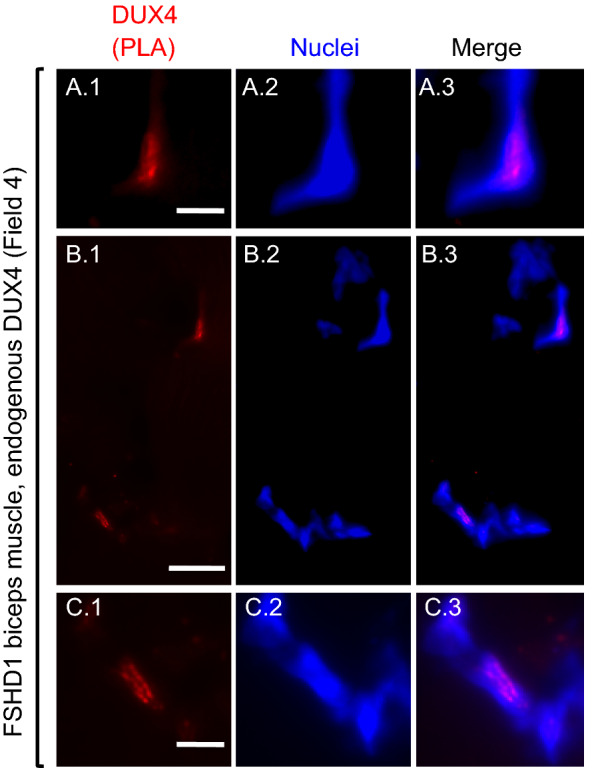
Fig. 3.

Nuclear DUX4 PLA signals in an FSHD1 biopsy (microscope field 4). As in Fig. 2, each row includes images from a single microscope field showing the DUX4 PLA signal (red), nuclei (blue), and merged PLA and nuclei signals. Images in row A include a nucleus-associated PLA signal (red); and this same region is also seen at lower magnification in the upper right corner of the images in row B. Images in row B show a lower magnification view of a field with two regions containing nucleus-associated PLA signals. Images in row C show at higher magnification the nucleus-associated PLA signal seen in the lower left corner of the row B images. Bar in A 1 = 5 µm for row A. Bar in B 1 = 15 µm for row B. Bar in C 1 = 5 µm for row C
