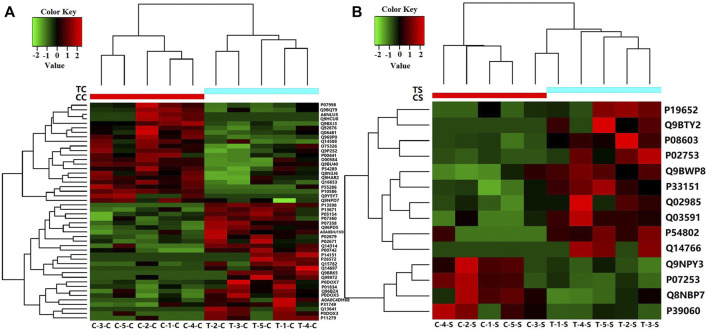
FIGURE 1.
Heat map showing levels of differentially expressed proteins for which relative quantitative values were obtained for five RRMS patients and five ONIND patients (Fold Change = 1.5). (A) Differentially expressed proteins in RRMS CSF. (B) Differentially expressed proteins in RRMS serum. CC(C-1-C, C-2-C, C-3-C, C-4-C, C-5-C), CSF from ONIND; TC (T-1-C, T-2-C, T-3-C, T-4-C, T-5-C), CSF from RRMS patients; CS(C-1-S, C-2-S, C-3-S, C-4-S, C-5-S), serum from ONIND; TS(C-1-C, C-2-C, C-3-C, C-4-C, C-5-C), serum from RRMS patients. The horizontal coordinate represents the symbol of the serum and CSF of each sample.

