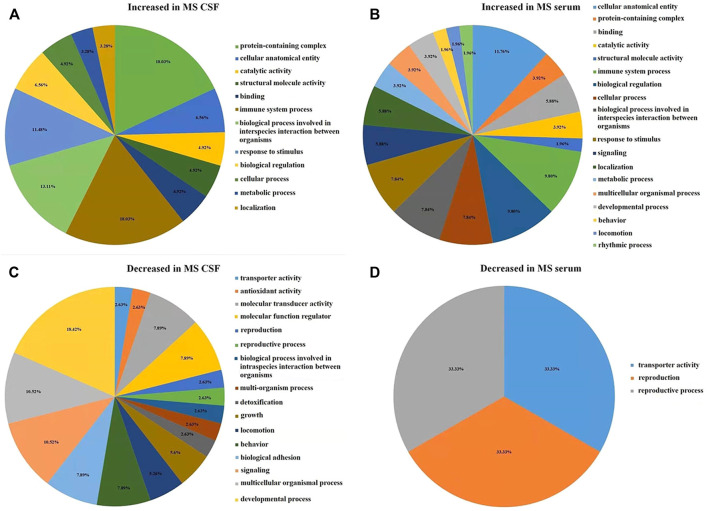
FIGURE 3.
The figure is calculated by the difference between the number of highly expressed and the number of low-expressed proteins in each GO item (Fold change = 1.5). (A) In RRMS CSF, the number of highly expressed proteins was higher than the number of low-expressed proteins in GO entries. (B) In RRMS serum, the number of highly expressed proteins was higher than the number of low-expressed proteins in GO entries. (C) In RRMS CSF, the number of low-expressed proteins was higher than the number of highly expressed proteins in GO entries. (D) In RRMS serum, the number of low-expressed proteins was higher than the number of highly expressed proteins in GO entries.

