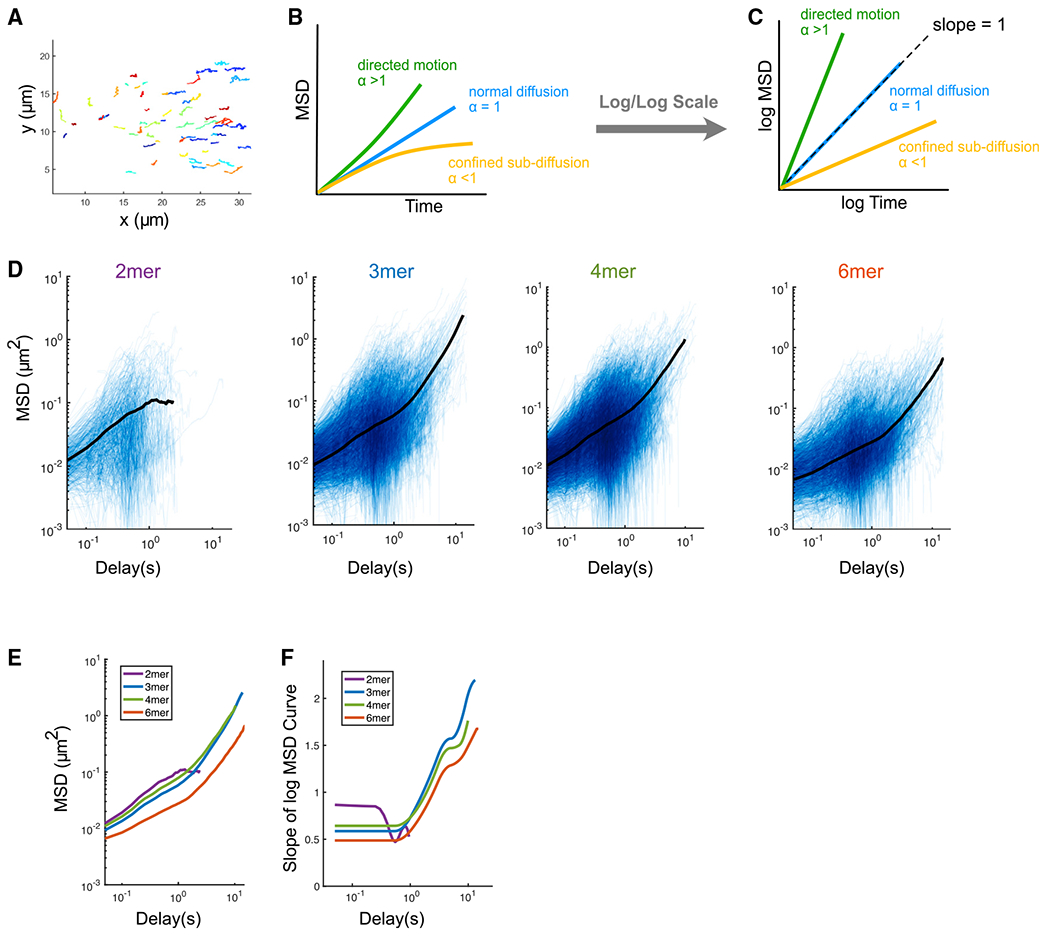
Figure 2. PAR-3 trimers and larger oligomers undergo directed motion due to cortical flow, while PAR-3 dimers do not.

(A) Tracks of engineered PAR-3 trimers imaged at the cortex during polarity establishment. Anterior is to the left. Different colors are only used for better visualization. t = 15 s.
(B) Illustration of the interpretation of anomalous parameters.
(C) Illustration of the interpretation of the MSD curve on log/log scales.
(D) Log/log scale MSD curves for dimer, trimer, tetramer, and hexamer, each curve describing the motion of a single PAR-3 cluster. For each plot, data were acquired and pooled from three embryos. Averaged MSD curves are shown for time lags defined by at least 20 data points.
(E) Comparison of the averaged MSD curves for dimer, trimer, tetramer, and hexamer.
(F) Slopes of the averaged MSD curves for dimer, trimer, tetramer, and hexamer, estimated by fitting a smoothing spline to each curve and then taking its derivative.
