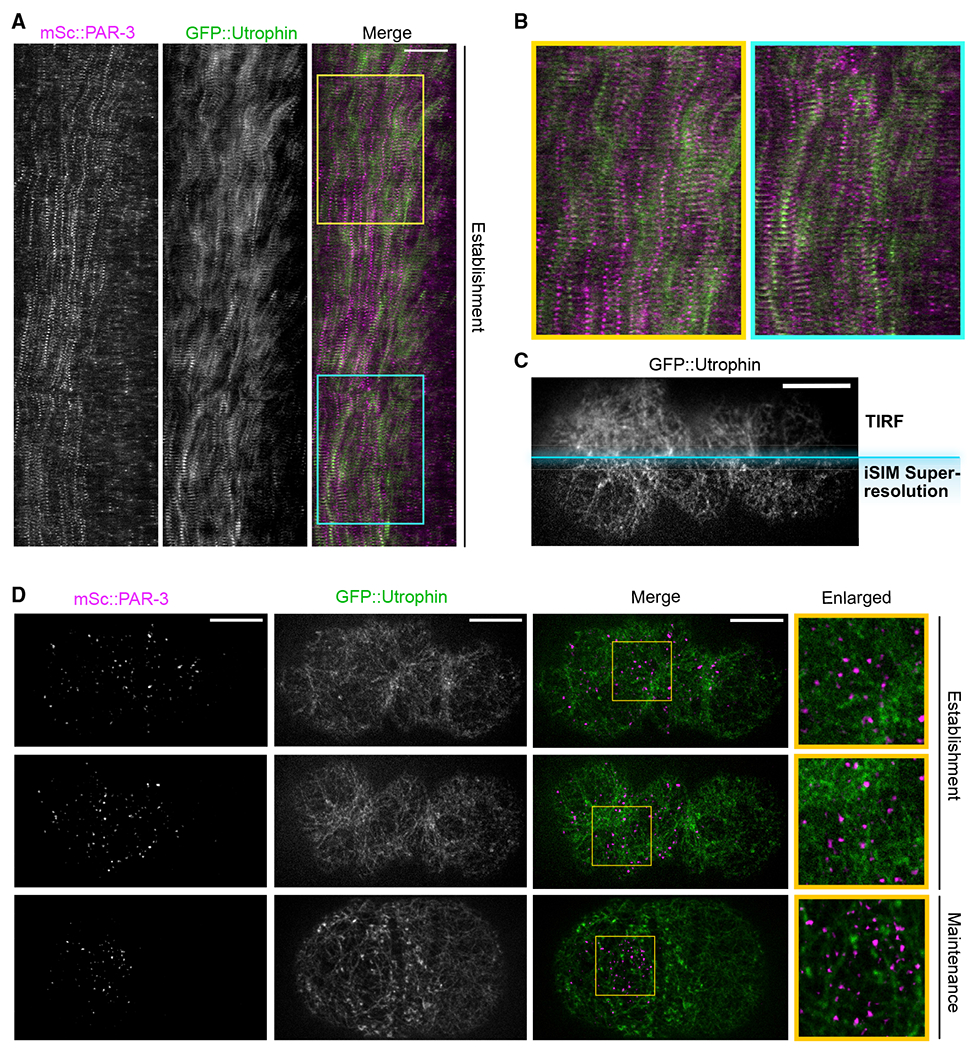
Figure 3. Super-resolution imaging reveals that PAR-3 moves in tandem with the actomyosin cortex despite not being physically associated with actin.

(A) Kymograph of cortical mSc::PAR-3 and utrophin::GFP during the first cell cycle. Embryos were imaged using TIRF at 3 s/frame. Anterior is to the left. Scale bar represents 10 μm. Yellow and blue boxes indicate regions enlarged in (B).
(B) Enlarged sections of kymograph (boxes) in (A).
(C) Comparison between TIRF imaging and high-resolution iSIM imaging. A mSc::PAR-3; GFP::UTRO zygote at polarization stage was imaged. Only the GFP::utrophin channel is shown. Scale bar represents 10 μm.
(D) Maximum projected z stacks of images of mSc::PAR-3; GFP::utrophin zygote, imaged using super-resolution iSIM imaging centered at the cortical region. Anterior is to the left. Scale bars represent 10 μm. Yellow box, region enlarged in right column.
