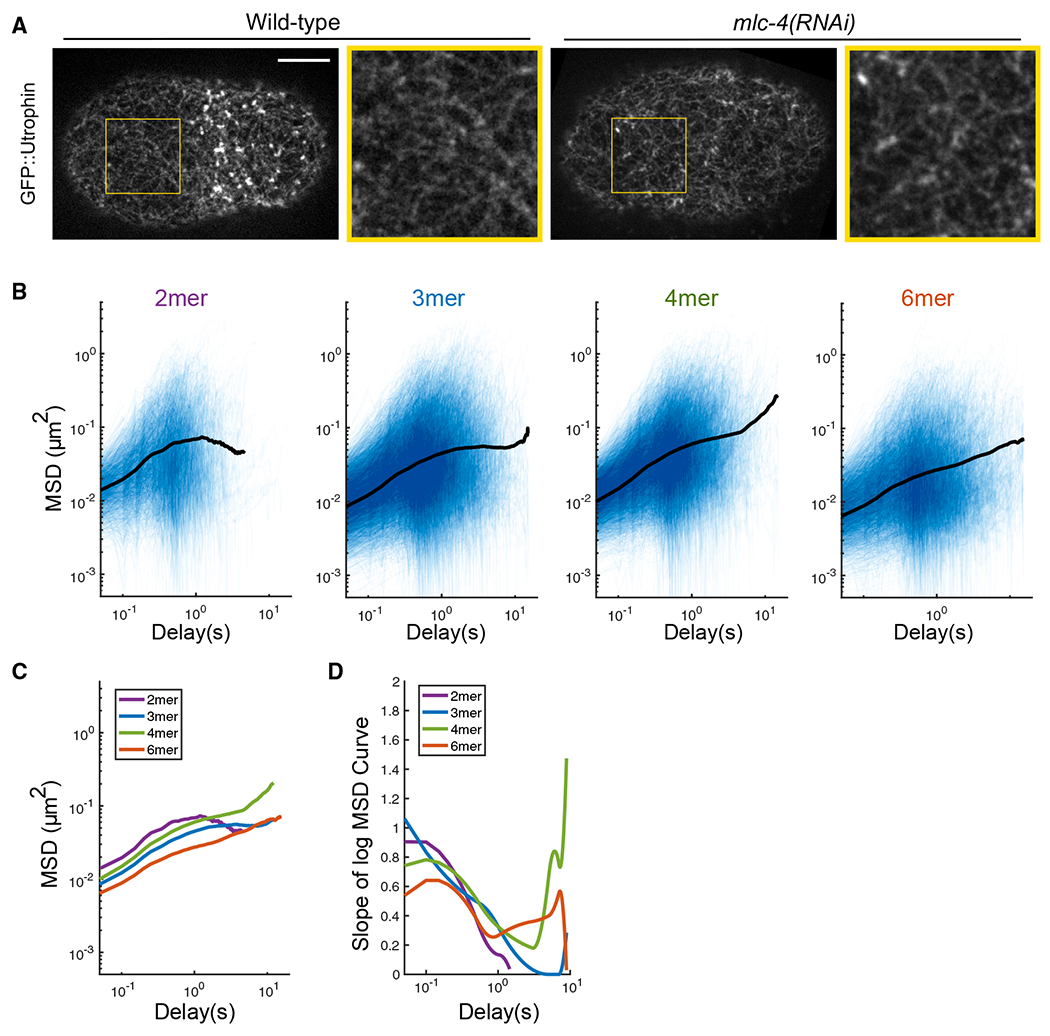
Figure 4. PAR-3 clusters are loosely confined by the transient physical interactions with the actomyosin cortex.

(A) Super-resolution iSIM images of GFP::utrophin zygotes at pronuclear meeting, with or without mlc-4 RNAi. The structure of the actin network is intact under mlc-4 RNAi. Yellow box, region enlarged to the right of each image. Scale bar represents 10 μm.
(B) log/log scale MSD curves for dimer, trimer, tetramer, and hexamer with mlc-4 RNAi treatment, each curve describing the motion of a single PAR-3 cluster. For each plot, data were acquired and pooled from three embryos. Averaged MSD curves are shown for time lags defined by at least 20 data points.
(C) Comparison of the averaged MSD curves for dimer, trimer, tetramer, and hexamer.
(D) Slopes of the averaged MSD curves for dimer, trimer, tetramer, and hexamer, estimated by fitting a smoothing spline to each curve and then taking its derivative.
