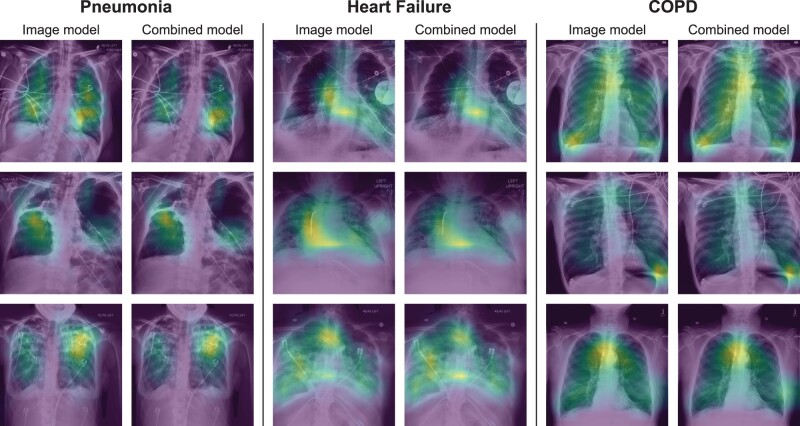
Figure 2.
Chest radiograph heatmaps in patients where the model correctly diagnosed pneumonia, heart failure, or COPD with high probability. The overlaying heatmap generated by Grad-CAM highlights the regions the model focused on when estimating the likely diagnosis (blue: low contribution, yellow: high contribution). For both the image and combined models, the model looked at the lungs and the heart when diagnosing pneumonia and heart failure, and the trachea when diagnosing COPD. Heatmaps were normalized on individual images to highlight the most important areas of each image, therefore heatmap values should not be compared across images. Image processing was performed, including histogram equalization to increase contrast in the original images, and then images were resized to 512 × 512 pixels.

