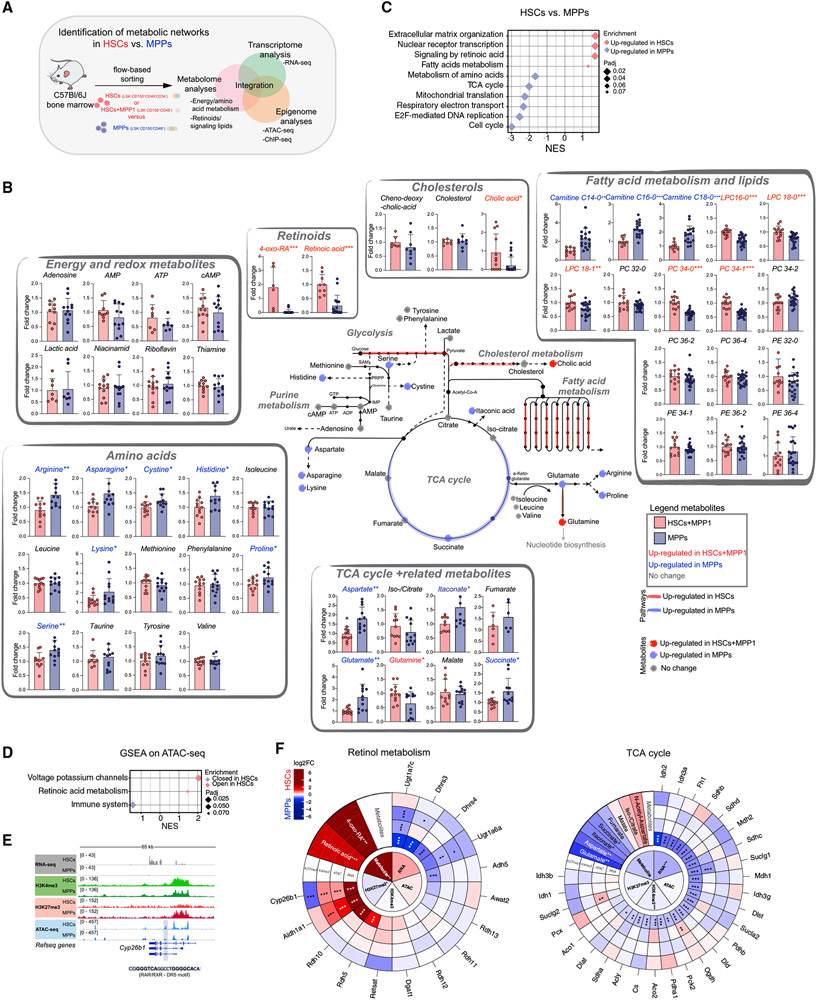
Figure 1. Metabolic and epigenetic landscape of HSCs and downstream progenitors.
(A) Summary of the experimental setup.
(B) Schematic integration of metabolomics results on HSCs+MPP1 and MPPs. Quantification is depicted as fold change (FC) + SD relative to HSCs+MPP1. Metabolite names and dots (upregulated in HSCs+MPP1)are shown in red (upregulated in MPPs) and blue. RNA-seq expression data of enzymes (padj. < 0.1) are shown as colored lines (red, upregulated in HSCs; blue, upregulated in MPPs; see also Figure S1F). n = 6–12; two to three independent experiments per metabolite; unpaired Student’s t test; *p < 0.05, **p < 0.01, ***p < 0.001.
(C) GSEA of selected Reactome pathways on RNA-seq data enriched in HSCs and MPPs (n = 3).
(D) GSEA of selected Reactome pathways on ranked differential OCRs between HSCs and MPPs in ATAC-seq.
(E) Gene tracks of the Cyp26b1 locus with corresponding RNA-seq, ATAC-seq, and H3K4me3 and H3K27me3 ChIP-seq coverage files.
(F) MTE plots integrating metabolomics, RNA-seq, ATAC-seq, and H3K4me3 and H3K27me3 ChIP-seq data on selected KEGG pathways. Depicted is log2FC between HSCs(+MPP1) and MPPs (red, upregulated in HSCs; blue, upregulated in MPPs). Significance was calculated using an unpaired Student’s t test (metabolomics dataset; *p < 0.05, **p < 0.01, ***p < 0.001) or by DESeq2 padj. value (sequencing datasets; *p < 0.1, **p < 0.05, ***p < 0.01).
Inner circles indicate the average tendencies of the entire KEGG pathway per dataset, and outer circles show individual genes/metabolites. n indicates the number of biological replicates.

