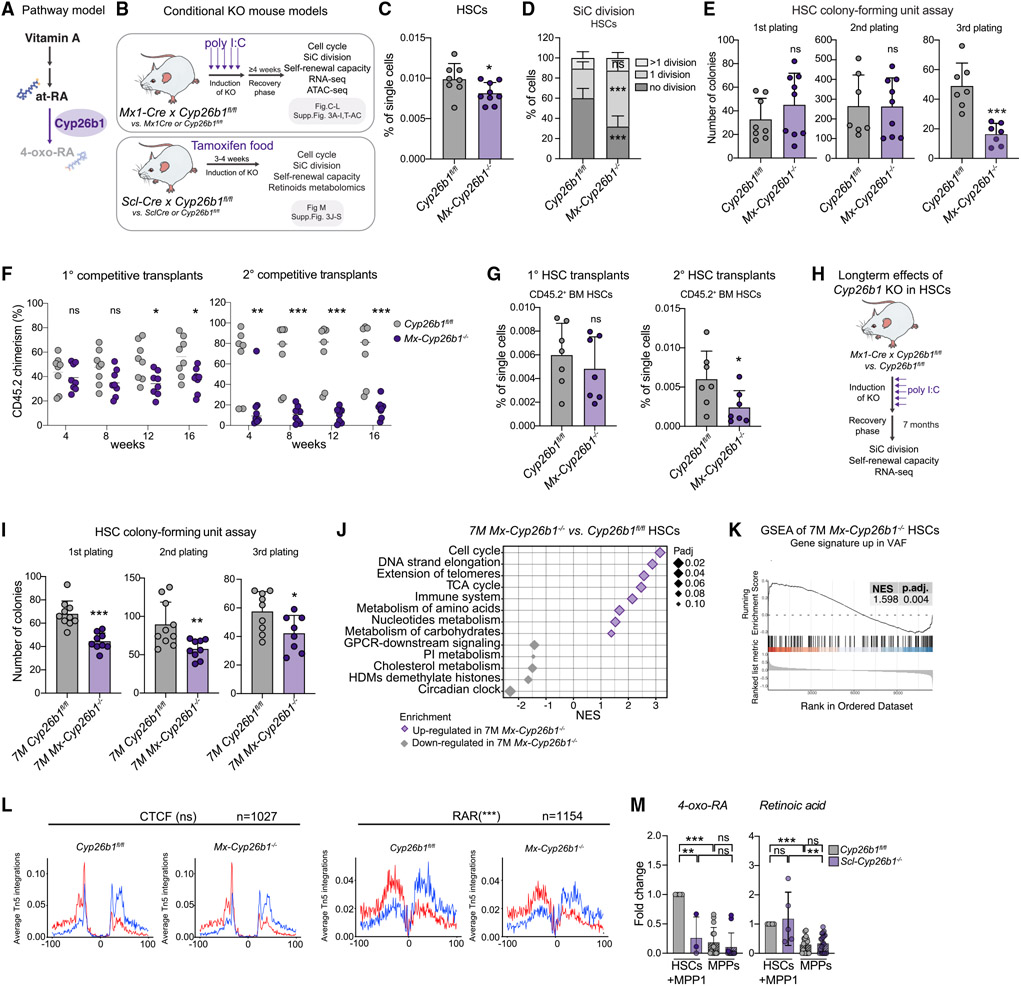
Figure 3. Cyp26b1 is critical for HSC self-renewal and quiescence.
(A) Pathway model.
(B) Workflow summarizing analyses performed on two Cyp26b1 KO mouse models (SclCre and Mx1Cre).
(C) Flow cytometry-based analysis of HSC frequency in Cyp26b1fl/fl (control) and Mx-Cyp26b1−/− (KO). Frequency of single cells is shown. Significance levels are compared with the control. n = 8–10.
(D) Single cell (SiC) division assay after 48h in Cyp26b1fl/fl and Mx-Cyp26b1−/− HSCs. Frequency of cells is shown in percent. n = 10–12.
(E) Colony-forming unit (CFU) assay of Cyp26b1fl/fl and Mx-Cyp26b1−/− HSCs; first, second, and third plating. n = 7–9.
(F) Flow cytometry-based analysis of CD45.2 PB chimerism of 1° and 2° competitive WBM transplantation assays of Cyp26b1fl/fl (CD45.2 control) and Mx-Cyp26b1−/− (CD45.2 KO) cells versus CD45.1/2 cells. Shown is percent CD45.2 chimerism. n = 7–8.
(G) Flow cytometry-based analysis of CD45.2+ HSCs after 16 weeks of 1° and 2° transplantation of HSCs derived from Cyp26b1fl/fl and Mx-Cyp26b1−/− Shown is the percentage of single cells. n = 7.
(H) Workflow summarizing analyses performed on long-term Cyp26b1 KO (Mx-Cyp26b1−/− and Cyp26b1fl/fl 7 months after deletion.
(I) CFU assay of HSCs in 7-month-old Cyp26b1fl/fl and Mx-Cyp26b1−/−; first, second, and third plating. n = 8–10.
(J) GSEA of selected Reactome pathways on RNA-seq of 7-month Mx-Cyp26b1−/− and Cyp26b1fl/fl HSCs.
(K) GSEA of “up-regulated genes in VAF HSCs” on RNA-seq of 7-month Mx-Cyp26b1−/− and Cyp26b1fl/fl HSCs. n = 2.
(L) ATAC-seq digital footprinting analysis on the CTCF and RAR motif in Mx-Cyp26b1−/− and Cyp26b1fl/fl HSCs. Tn5 insertions are shown on positive and negative strands (red and blue, respectively). n = 2.
(M) Targeted metabolomics on retinoids in Scl-Cyp26b1−/− and Cyp26b1fl/fl HSCs+MPP1. Shown is FC compared with Cyp26b1fl/fl HSCs+MPP1. n = 3–12.
(C)–(E), (G), (I), and (M), mean + SD; (C), (E), (G), (I), and (L), unpaired Student’s t test; (D) and (F), two-way ANOVA. *p < 0.05, **p < 0.01, ***p < 0.001. n indicates the number of biological replicates. For (C)–(G), (I), and (M), two or more independent experiments were performed.

