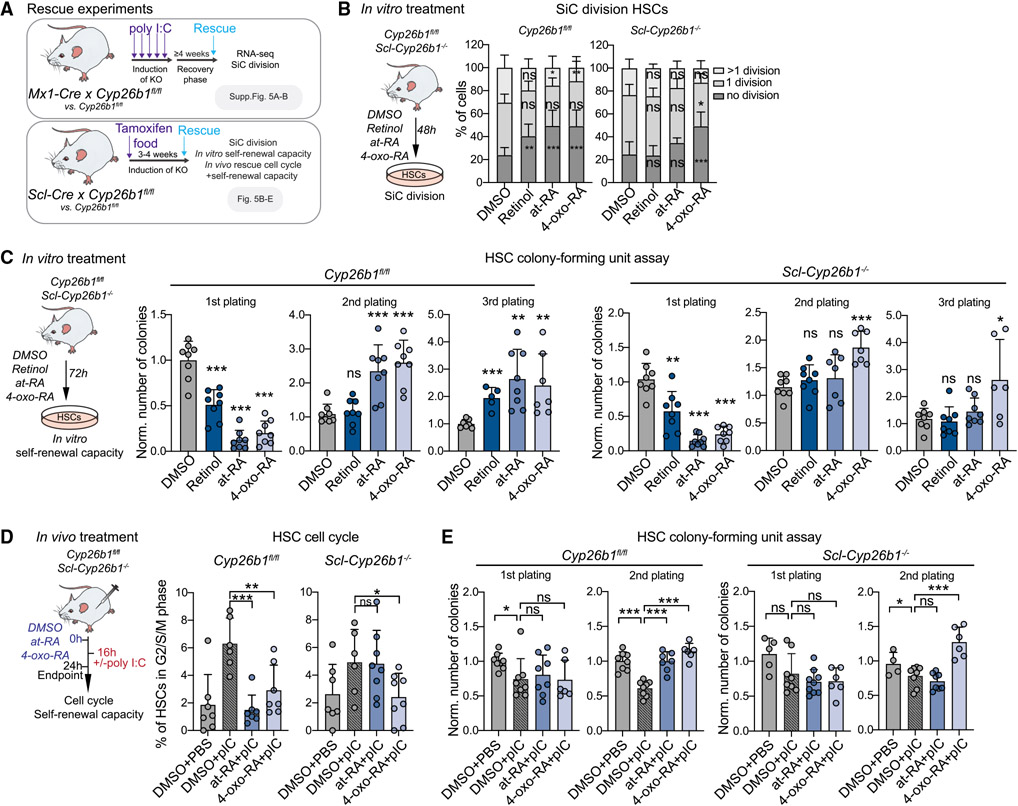
Figure 5. The Cyp26b1-downstream metabolite 4-oxo-RA is required for HSC maintenance.
(A) Workflow showing rescue experiments performed on the different Cyp26b1 KO mouse models.
(B) Workflow showing the single cell (SiC) division assay after 48 h in vitro treatment of Scl-Cyp26b1−/− compared with Cyp26b1fl/fl HSCs with DMSO, retinol, at-RA, and 4-oxo-RA. The percentage of cells is shown. n = 12.
(C) Workflow depicting the colony-forming unit (CFU) assay after 72 h in vitro treatment of Scl-Cyp26b1−/− compared with Cyp26b1fl/fl HSCs with DMSO, retinol, at-RA, and 4-oxo-RA. The number of colonies was normalized to control DMSO treatment of each corresponding plating. n = 6–8.
(D) Workflow showing in vivo treatments with DMSO + PBS, DMSO + poly I:C (pIC), at-RA + pIC, and 4-oxo-RA + pIC of Scl-Cyp26b1−/− compared with Cyp26b1fl/fl mice and flow cytometry-based analysis of the HSC cell cycle. The percentage of HSCs in the G2/S/M cell cycle phase is shown. Significance levels are compared with DMSO pIC. n = 6–7.
(E) HSC CFU assay after 72 h in vivo treatment of Scl-Cyp26b1−/− and Cyp26b1fl/fl mice with DMSO + PBS, DMSO + pIC, at-RA + pIC, and 4-oxo-RA + pIC. The number of colonies was normalized to DMSO + PBS treatment of each corresponding plating. n = 4–8.
(B)–(E), mean + SD; (C)–(E), unpaired Student’s t test; (B), two-way ANOVA. *p < 0.05, **p < 0.01, ***p < 0.001. n indicates the number of biological replicates. Significance levels are compared with the control. For (B)–(E), two or more independent experiments were performed.

