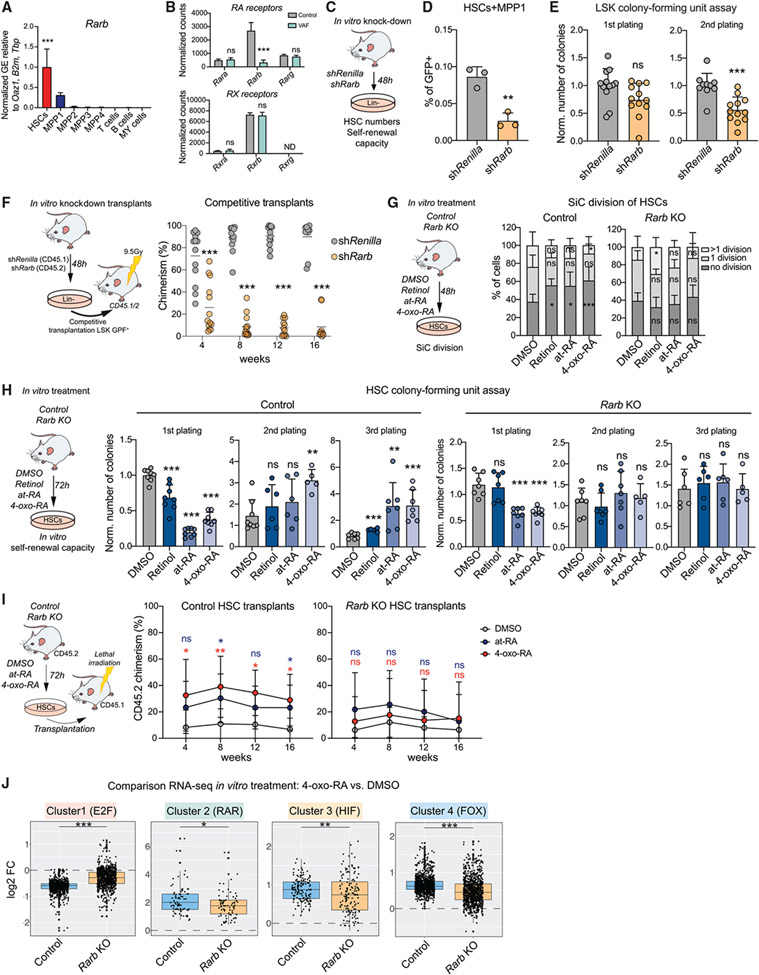
Figure 6. Rarb is required to mediate 4-oxo-RA-dependent maintenance of HSC self-renewal.
(A) RT-qPCR of Rarb GE in stem and progenitor populations and differentiated cells. Normalized mean relative to Oaz1, B2m, and Tbp expression and relative to HSCs is shown. Significance in HSCs is compared with all other populations. n = 3, one experiment.
(B) Normalized expression counts (DESeq2) of RAR and RXR genes from VAF RNA-seq. DESeq2 padj. values: *p < 0.1, **p < 0.05, ***p < 0.01.
(C) Workflow showing in vitro Rarb KD.
(D) Flow cytometry-based analysis of the frequency of HSCs+MPP1 (LSK CD150+CD48−). The percentage of single cells is shown. n = 3, one experiment.
(E) Colony-forming unit (CFU) assay of GFP+ LSK cells after in vitro Rarb KD; first and second plating. The number of colonies was normalized to the control. n = 12.
(F) Workflow showing competitive transplantation of GFP+LSK shRarb (CD45.2) and GFP+LSK (CD45.1) and flow cytometry-based analysis of PB chimerism over time. Shown is the percentage of chimerism. n = 12–16.
(G) Workflow showing the single cell (SiC) division assay after 48-h in vitro treatment of control HSCs compared with Rarb KO with DMSO, retinol, at-RA, and 4-oxo-RA. The percentage of single cells is shown. n = 12.
(H) Workflow depicting CFUs after 72-h in vitro treatment of control HSCs compared with Rarb KO with DMSO, retinol, at-RA, and 4-oxo-RA. The number of colonies was normalized to control DMSO treatment of each corresponding plating. n = 6–8.
(I) Transplantation assay comparing 72-h in-vitro-treated control and Rarb KO HSCs with at-RA, 4-oxo-RA, or DMSO. Shown is the percentage of CD45.2 chimerism over time. n = 6–9.
(J) Boxplots comparing 24-h in vitro 4-oxo-RA effects on GE in control and Rarb KO HSCs+MPP1 RNA-seq versus DMSO treatment. All genes of heatmap clusters 1–4 from RNA-seq of in vitro treatments after 24 h (Figure 4K) are shown. n = 2–3.
(A), (B), (D), (E), (G), and (I), mean + SD; (A), (D), (E), and (H), unpaired Student’s t test; (F), (G), and (I), two-way ANOVA. *p < 0.05, **p < 0.01, ***p < 0.001. n indicates the number of biological replicates. For (B)–(F), two or more independent experiments were performed.

