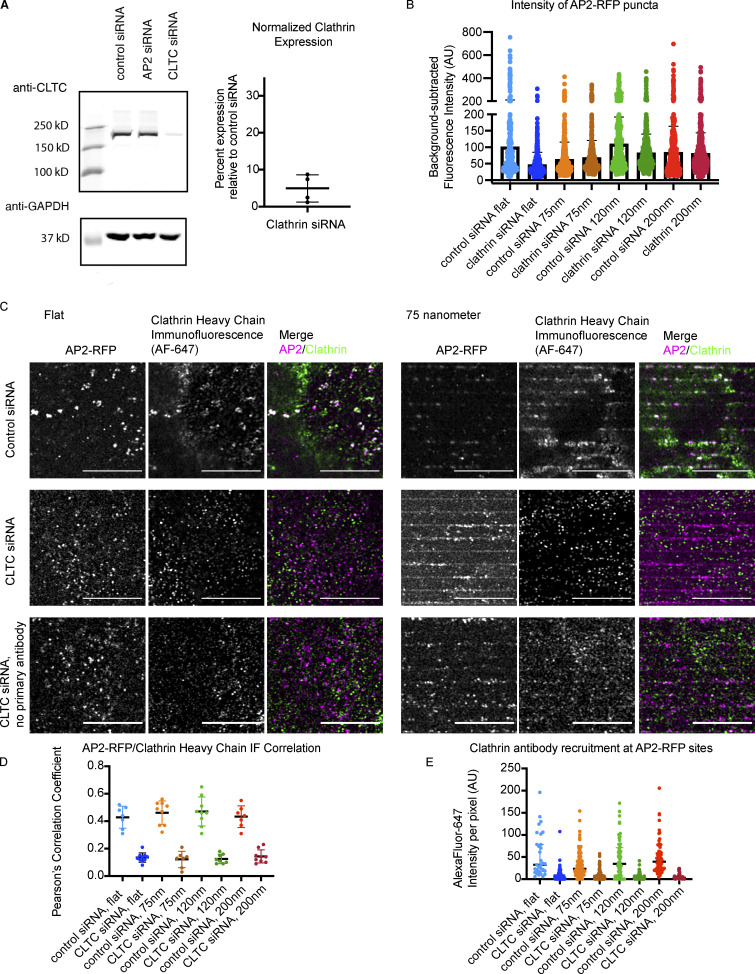
Figure S4.
Clathrin siRNA reduces expression and detection through IF. (A) Western blot demonstrating reduced clathrin heavy chain expression upon siRNA treatment, with quantification of average knockdown efficiency. Mean ± SD, n = 4. (B) Intensity of AP2-RFP puncta with control or clathrin siRNA. Mean with interquartile range, n ≥ 350 puncta from three cells per condition. (C) Representative images of IF to clathrin heavy chain from control and clathrin knockdown cells on flat substrates or 75-nm ridges, highlighting reduced clathrin heavy chain detection after knockdown regardless of curvature. (D) Pearson’s correlation coefficient of AP2-RFP and clathrin heavy chain IF with or without clathrin knockdown. Mean ± SD, n = 10 cells per condition. (E) Quantification of clathrin heavy chain fluorescence intensity per pixel at sites of AP2-RFP for flat or curved substrates with and without knockdown. Mean with interquartile range; n ≥ 200 puncta form three cells per condition.

