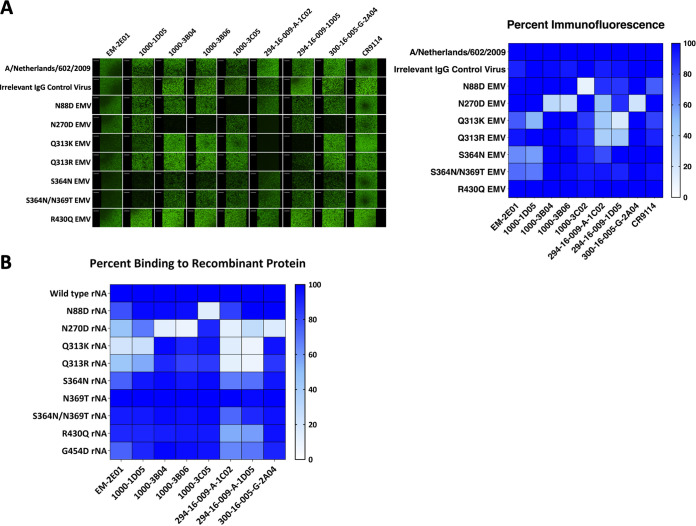
FIG 2.
mAbs exhibit changes in binding activity toward EMVs. (A) Immunofluorescence assay comparing the binding of each mAb to the wild type and EMVs. On the left are representative images, and the right shows a heat map of percent fluorescence compared to the wild type. On the heat map, high binding is indicated by darker blue shading. Immunofluorescence assay images are representative of results from 2 independent experiments. (B) Percent binding of mAbs to rNA proteins determined using an ELISA. ELISAs were performed in triplicate, with average percent binding reported in the figure.

