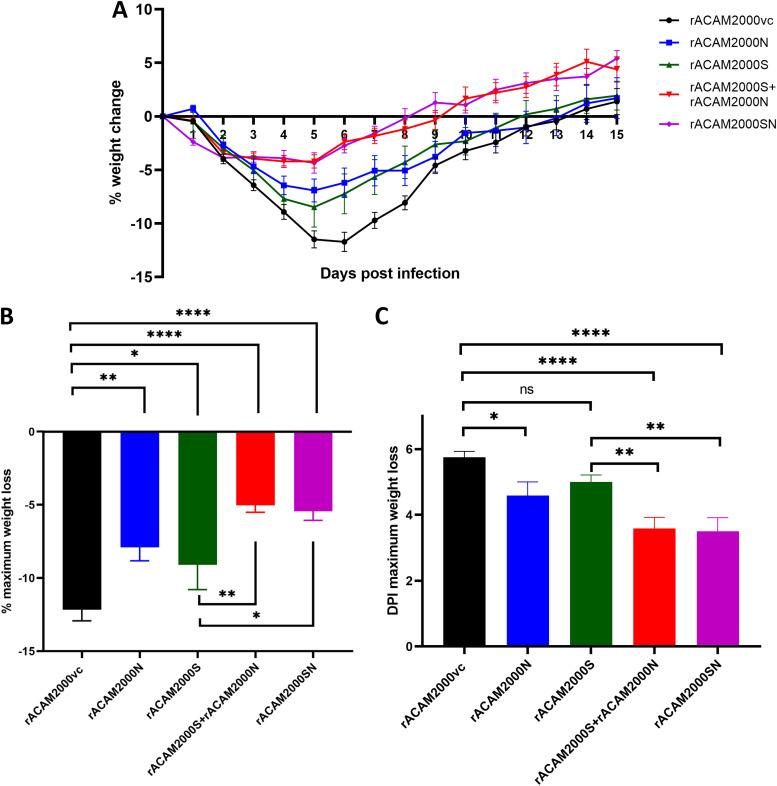
FIG 3.
Weight loss of hamsters following SARS-CoV-2 challenge. (A) Percentage of daily weight change of hamsters up to 15 days after SARS-CoV-2 challenge. (B) The maximum weight loss after SARS-CoV-2 challenge. (C) The day postinfection (DPI) when the maximum weight loss was observed. Data are represented as mean ± standard error of the mean (SEM). The P values were calculated with a one-way analysis of variance (ANOVA) using GraphPad Prism 8.0 package. ****, P < 0.0001; ***, P < 0.001; **, P < 0.01; *, P < 0.05; ns, not significant.

