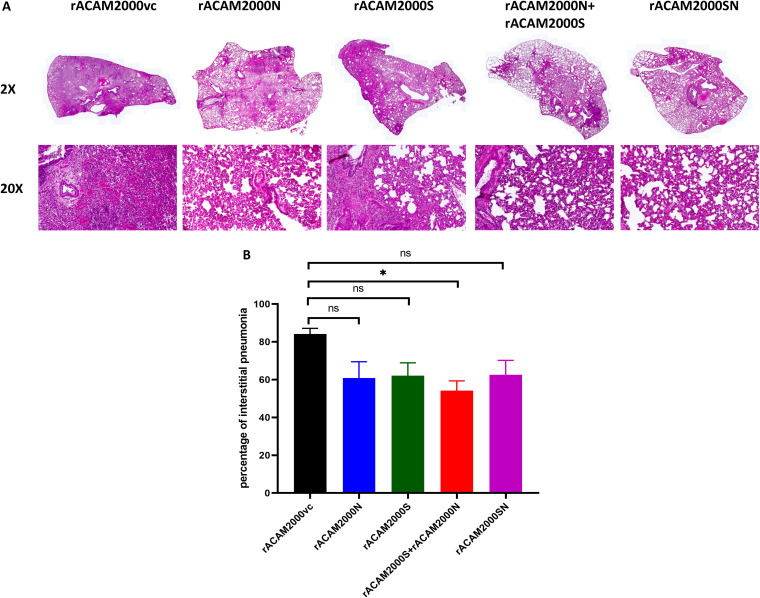
FIG 8.
Histopathological analysis. (A) Representative images of hematoxylin-and-eosin-stained, formalin-fixed, paraffin-embedded tissues at ×2 and ×20 magnifications. (B) Percentage of marked interstitial pneumonia from each hamster lung lobes. Data are represented as mean ± SEM. The P values were calculated with a one-way analysis of variance (ANOVA) using the GraphPad Prism 8.0 package. *, P < 0.05; ns, not significant.

