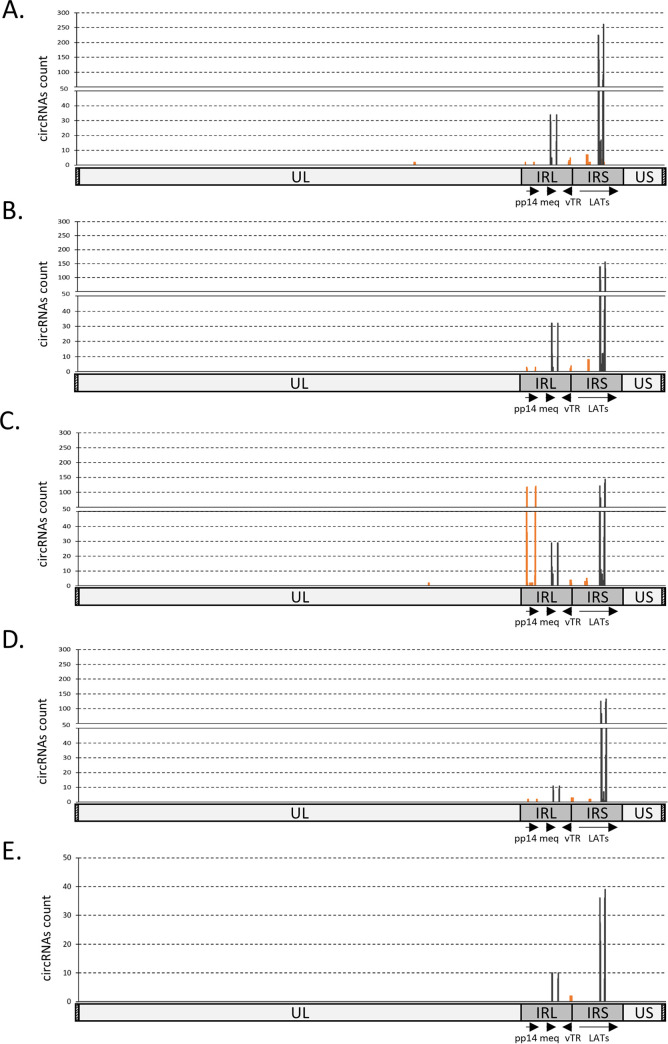
FIG 6.
In vivo expression of MDV circular RNAs. Localization plots of identified circRNAs from five in vivo RNA-seq samples (A to E), mapped on the full-length MDV genome (without the terminal repeat regions) represented on the x-axis. The peaks represent raw counts of the mapped reads. The reads were filtered on the fact that they encompass a back-splicing event. Each plot (A to D) represents the mapping of circRNAs extracted from a single infected animal with MDV-induced tumors (TA+). (E) The mapping of circRNAs extracted from a single infected animal that did survive the viral infection (TA−). Dark lines represent the coverage of identified canonical U2 circRNAs and orange lines represent the coverage of identified noncanonical circRNAs.

