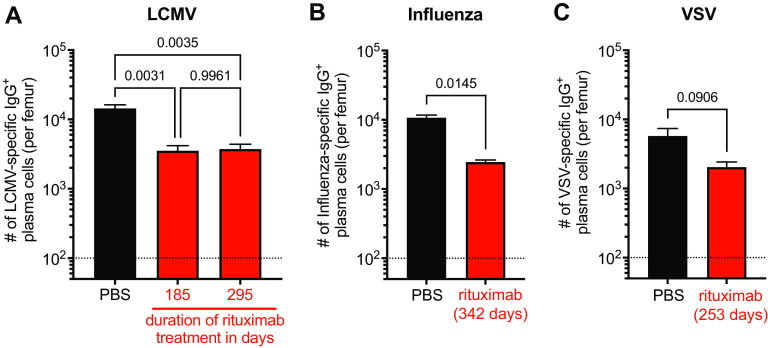
FIG 4.
Analysis of virus-specific IgG+ plasma cells in the bone marrow of rituximab-treated mice. Virus-specific plasma cell numbers in the bone marrow of rituximab- (red) or PBS- (black) treated hCD20tg mice were quantified by ELISPOT. (A) Number of LCMV-specific IgG-producing bone marrow (BM) plasma cells per femur after 185 and 295 days of continuous treatment. (B) Number of influenza virus-specific BM plasma cells per femur after 342 days of continuous treatment. (C) Number of VSV-specific BM plasma cells per femur after 253 days of continuous treatment. Data (mean and SEM) from one experiment with n = 2 to 6 mice per group are shown. One-way ANOVA with Tukey’s multiple comparison test (A) and unpaired two-sided t test (B and C) was used for analyses with P values being indicated.

