. 2022 Apr 21;13(18):5345–5352. doi: 10.1039/d2sc01672a

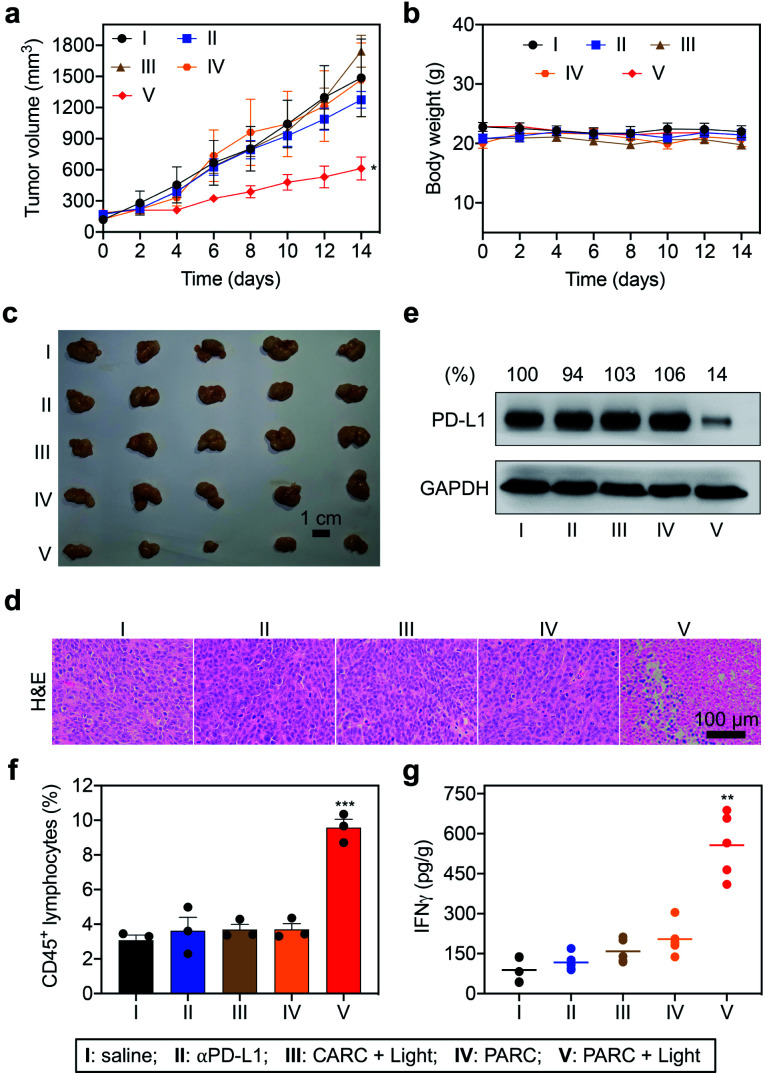
Fig. 4. (a) Tumor growth curves and (b) body weights of HCT116 tumor-bearing NCG mice that were intravenously injected with saline, αPD-L1 (0.7 nmol), CARC (0.7 nmol), or PARC (0.7 nmol) every 3 days for a total of 4 injections. Tumors were irradiated with 365 nm light (50 mW cm−2) for 5 min at 4 h post each injection. (c) Optical images, (d) H&E staining, (e) western blotting analysis of PD-L1, (f) flow cytometry analysis of CD45+ lymphocytes, and (g) IFNγ levels. (e) Relative intensity ratios of PD-L1/GAPDH are shown at the top. Data are shown as mean ± SD (n = 3–5). *P < 0.05, **P < 0.01, and ***P < 0.001, relative to the other groups.

Fig. 4