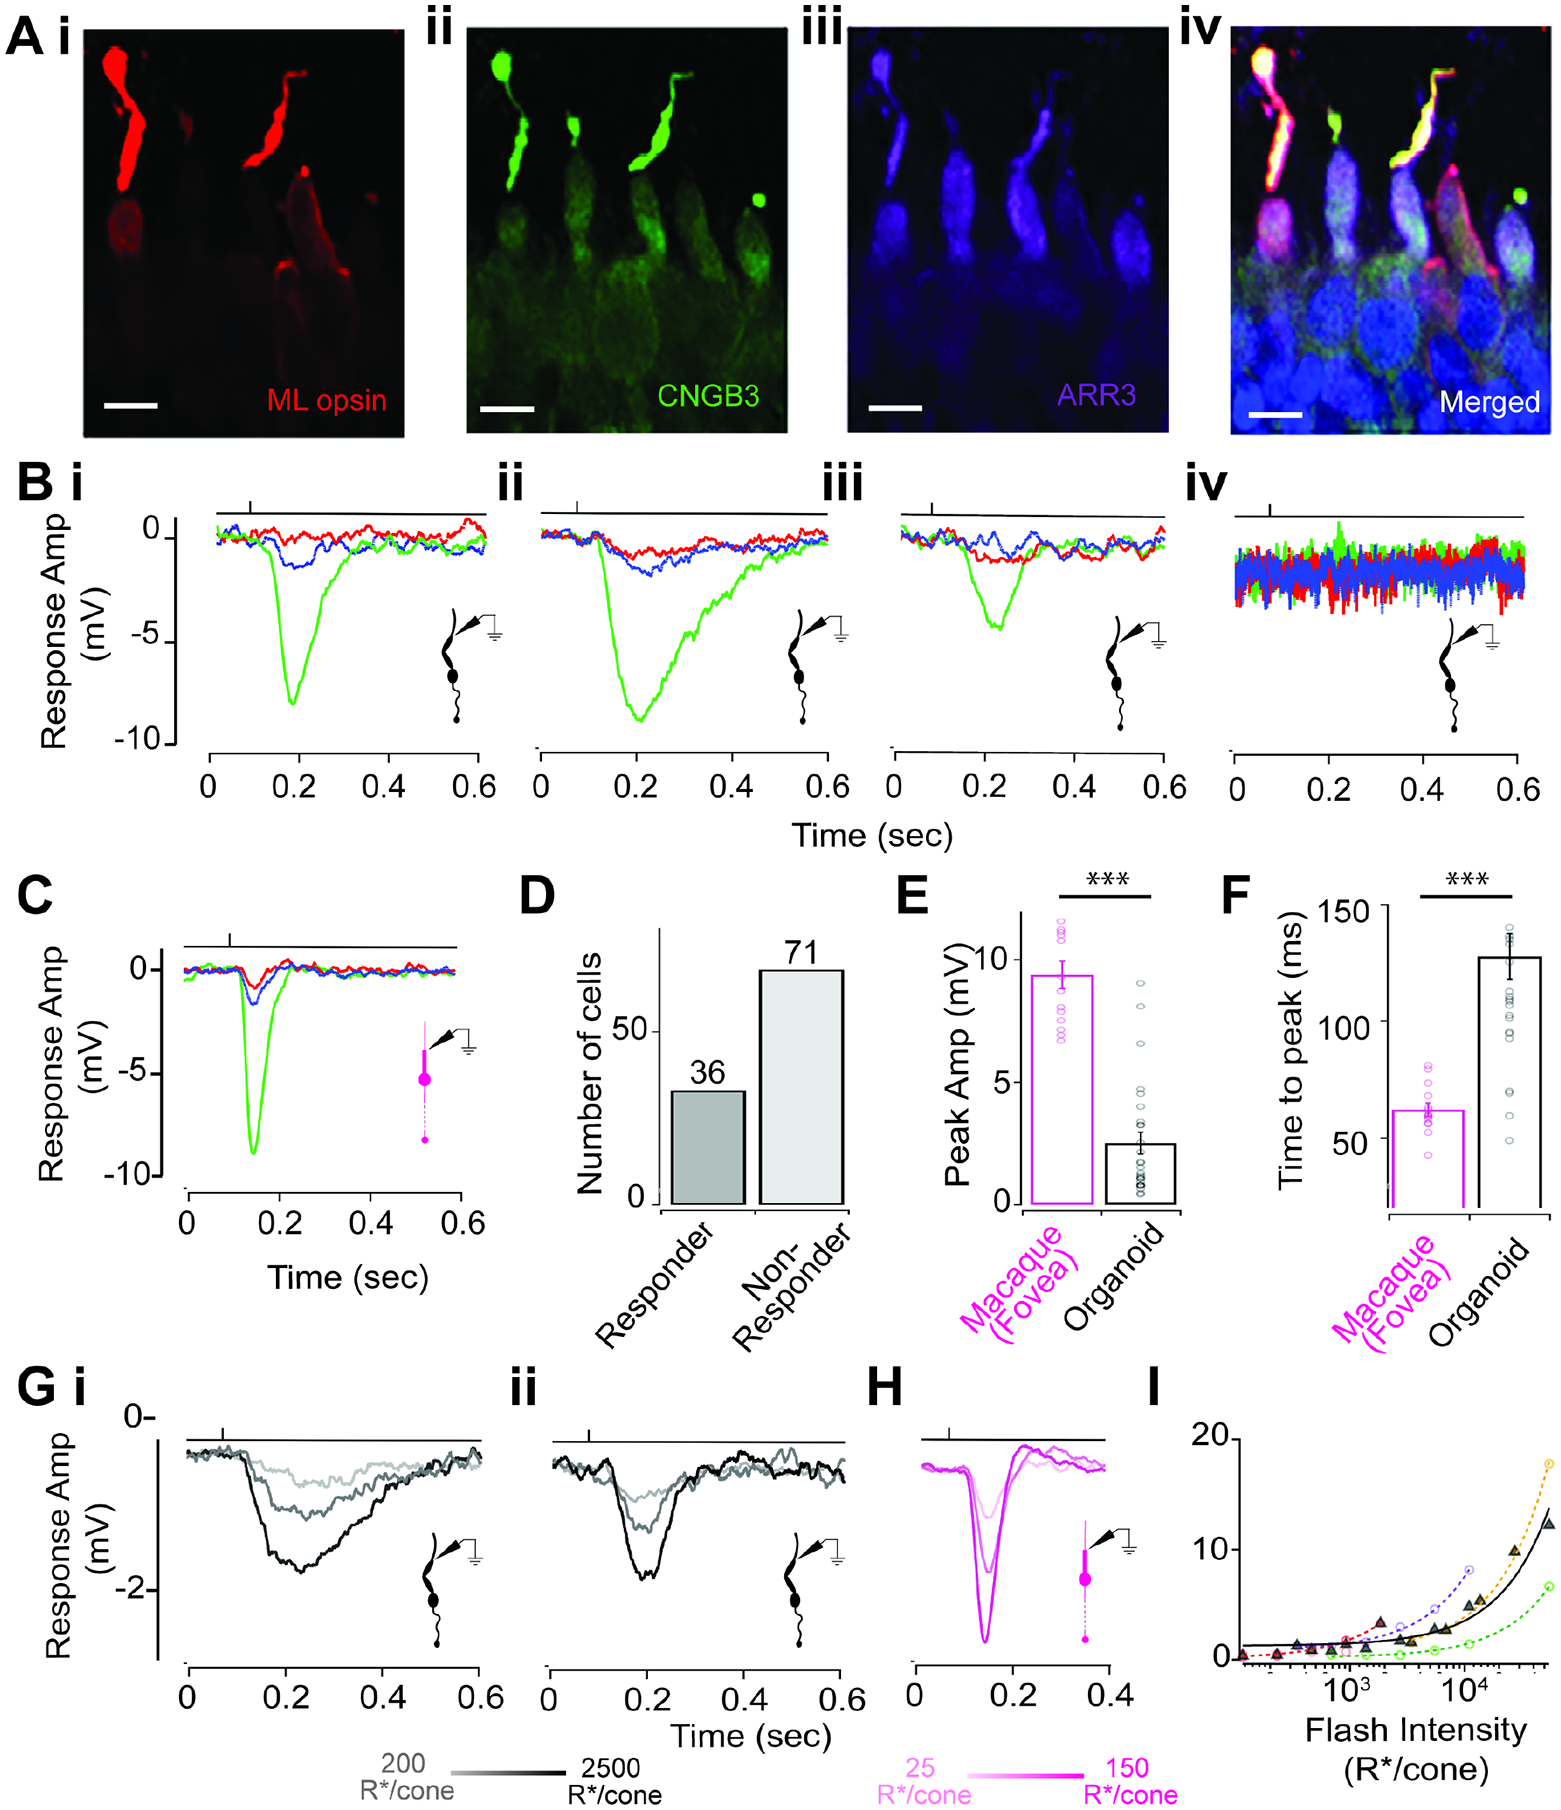
Figure 1: Comparison of light responses from RO cones and primate foveal cones.

(A) RO cones labeled for components of the phototransduction machinery. Red, M/L opsin (i); green, CNGB3 (ii); violet, ARR3 (iii); merged (iv). Scale bars: 10 μm.
(B) Exemplar traces showing responses to a 10-ms typing flash stimulus. (i–iv). Henceforth, for all figures, the time point of the light stimulus is denoted by the vertical line above the response traces.
(C) Exemplar response to typing flash stimuli of a macaque foveal cone (M-cone).
(D) Bar plot showing the number of cones that responded to the typing light flash (responders; n = 36) versus those that did not (nonresponders; n = 71).
(E) Comparison of peak amplitude of cone voltage responses to typing flash stimulus in RO cones (black) and macaque foveal cones (magenta) (fovea: 9.37 ± 0.56 mV, n = 14; RO: 2.51 ± 0.45 mV, n = 27; p value = 2.4 × 10⁻¹¹).
(F) Voltage responses to the typing flash were slower for RO cones than for macaque foveal cones (foveal cones: 62.2 ± 2.77 ms, n = 14; RO cones: 127.57 ± 9.69 ms, n = 27; p value = 0.00002).
(Gi and Gii) Examples of voltage responses of dark-adapted RO cones to 10-ms flashes of increasing light intensities eliciting 200, 1,000, and 2,500 cone opsin photoisomerizations (R*)/cone/flash.
(H) Exemplar voltage responses of a dark-adapted macaque foveal cone to 10 ms flashes of light intensities of 25, 75, and 150 R*/cone/flash.
(I) RO cone responses did not saturate for flash intensities tested. Response amplitude increased linearly over three orders of magnitude of light flash intensities (black, average response across multiple RO cones; colored traces, response for individual cones). Values in all figures represent mean ± SEM.
