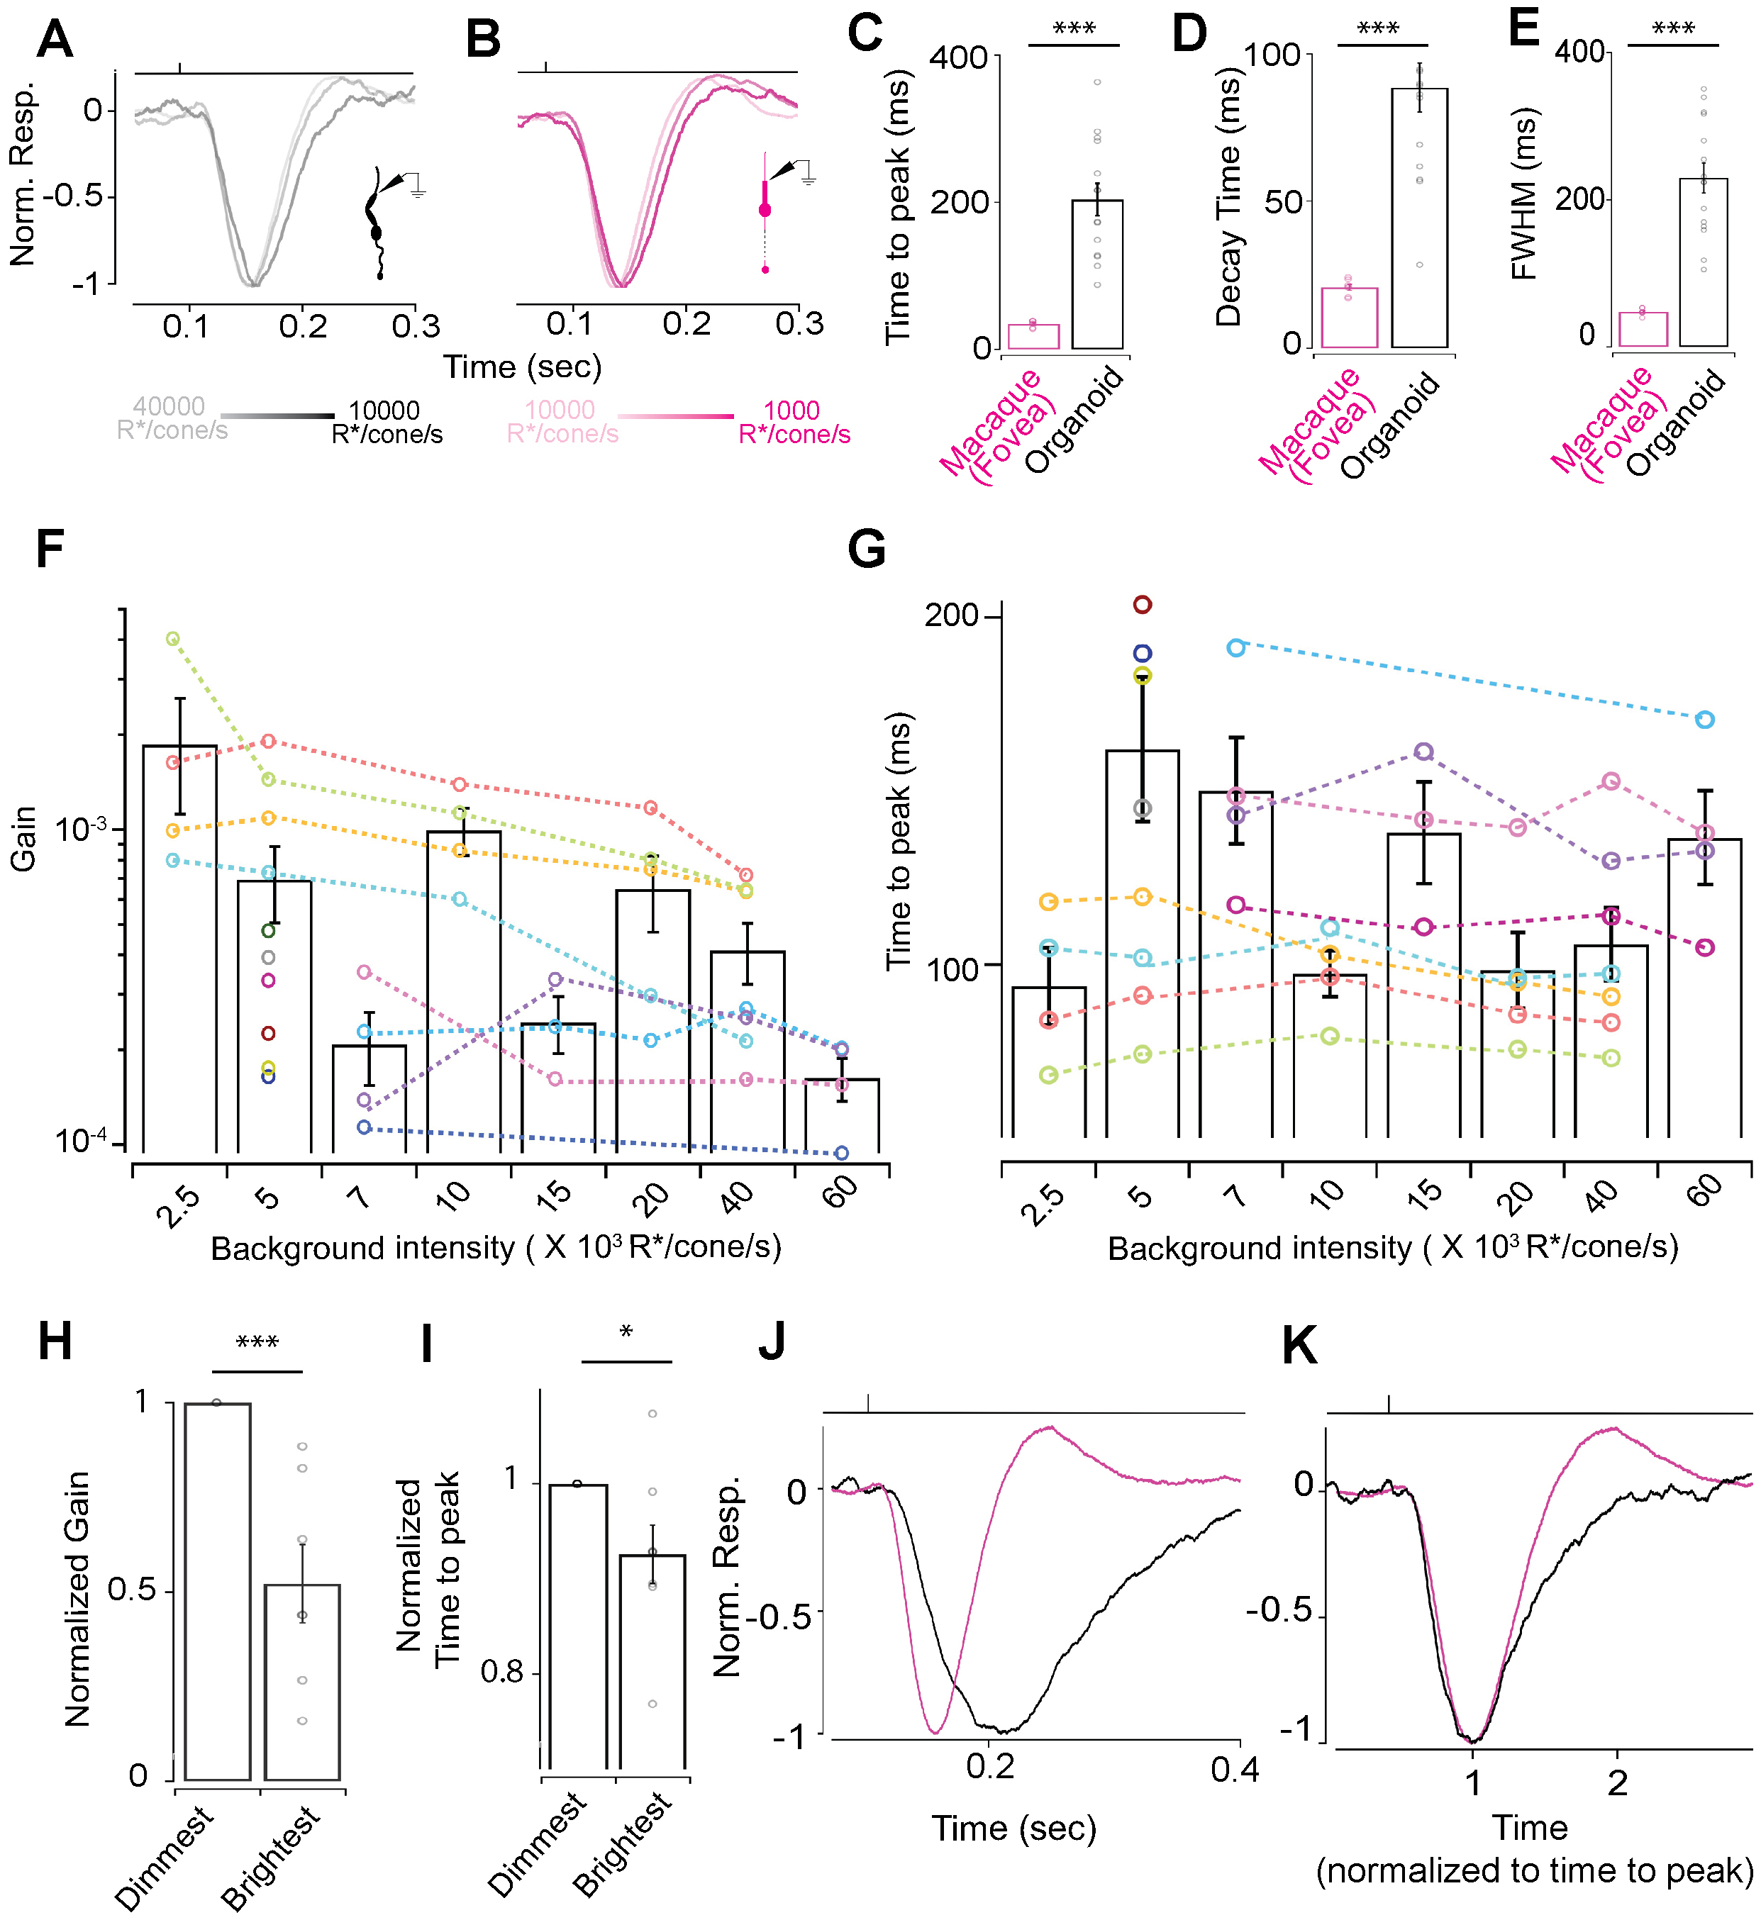
Figure 2: RO cones respond over a wide range of mean luminance.

(A, B) Exemplar voltage responses to 10 ms 200% contrast flashes at varying background luminance. (A) Exemplar voltage responses by a RO cone to a 10 ms 200% contrast flash at 10000, 20000 or 40000 R*/cone/s background light-levels (B). Exemplar voltage responses by a primate foveal cone to a 10 ms 200% contrast flash at 1000, 5000 or 10000 R*/cone/s background light-levels. (C-E) Characterization of the average response of multiple foveal and RO cones to a 10 ms 200% contrast flash at a background of 5000 R*/cone/s. (C) Time to peak for primate foveal cones (34.8 ± 1.73 ms, n=7) and RO cones (203.8 ± 21.1 ms, n=15). Response decay time as in (C) for foveal cones (20.7 ± 1 ms, n=7) and RO cones (88.5 ± 8.4 ms, n=15). (E) Full width at half maxima as in (C) for foveal cones (47.7 ± 1.8 ms, n=7) and RO cones (229.5 ± 20.5 ms, n=15). (F) Gain decreases with increase in background luminance in individual RO cones (colored lines). Bar graph shows the average gain and the distribution of gain values at a given background luminance across RO cones. (G) Time to peak decreases for individual RO cones over increasing background luminance (colored lines). Bar graph represents the average time to peak and the distribution of times to peak at a given background luminance across RO cones. (H) Gain at the brightest background was normalized by gain at the lowest background luminance for each cell and showed a 50% reduction. (I) Time to peak of the cone light response at the brightest background was normalized by time to peak at the lowest background luminance for each cell and showed a significant increase. (J) Normalized average responses across five RO (black) and foveal (magenta) cones to a 10ms 300% contrast light flash at a background luminance of 5000R*/cone/sec. (K) Average responses shown in panel J superimposed with the time to peak normalized to one.
