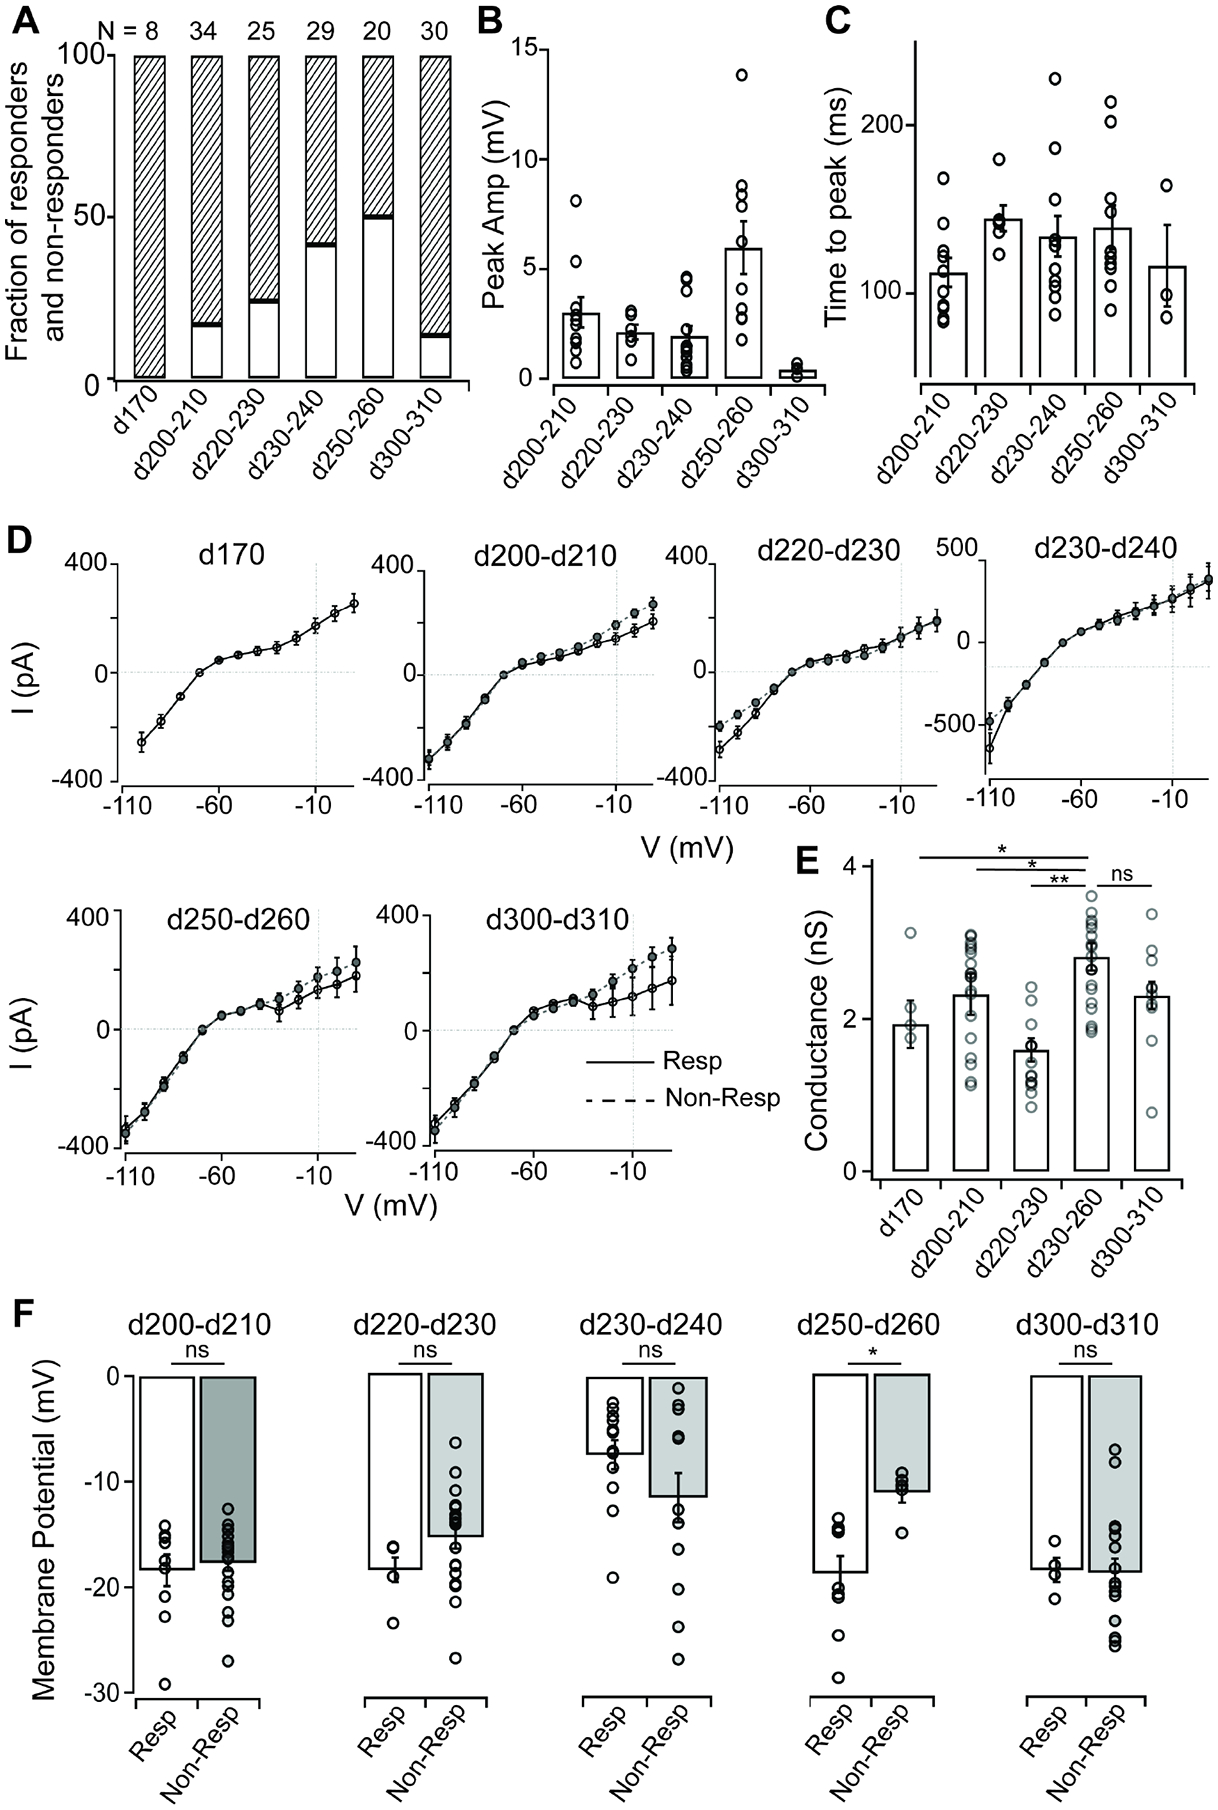
Figure 4: Comparison of light evoked responses and passive membrane properties of RO cones across different developmental timepoints.

(A) Fraction of responders versus nonresponders in stage 3 RO cones from WA09 organoids cultured for increasing amounts of time.
(B) Comparison of peak amplitude of RO cone voltage responses to a brief flash of light (~500,000 R*/cone/s) across time points (d200–d210: 3.02 ± 0.69 mV, n = 10; d220–d230: 2.13 ± 0.33 mV, n = 6; d230–d240: 1.95 ± 0.45 mV, n = 12; d250–d260: 5.97 ± 1.20 mV, n = 10; d300–d310: 0.42 ± 0.17 mV, n = 3). RO cones at d250–d260 had the maximum sensitivity to the light flash.
(C) Time to peak is consistent for RO cone voltage responses to a brief flash of light (~500,000 R*/cone/s) across developmental time points (d200–d210: 112.35 ± 8.69 ms, n = 10; d220–d230: 144.58 ± 7.68 ms, n = 6; d230–d240: 133.79 ± 12.09 ms, n = 12; d250–d260: 139.33 ± 12.96 ms, n = 10; d300–d310: 116.30 ± 24.21 ms, n = 3).
(D) Comparison of current-voltage (I–V) curves for responder and nonresponder RO cones at different developmental time points. RO cones at later stages of development (>d230) had greater hyperpolarization-activated currents.
(E) RO cones at d230–d260 of development had maximal ion conductance at hyperpolarizing membrane potentials (−100 mV, liquid junction potential corrected) (d170: 2.83 ± 0.39 nS, n = 4; d200–d210: 2.89 ± 0.05 nS, n = 19; d220–d230: 2.04 ± 0.18 nS, n = 15; d230–d260: 2.81 ± 0.18 nS, n = 20; d300–d310: 2.90 ± 0.25 nS, n = 10) (d170 vs d230–260, p value = 0.015; d200–210 vs d230–260, p value = 0.045; d220–230 vs d230–260, p value = 0.007; d300–310 vs d230–260, p value = 0.079).
(F) Resting membrane potential of responder versus nonresponder RO cones at different time points of development. Apart from d250–d260 time point of development, there was no significant difference between responders and nonresponders at any other time points. Responder RO cones at d230–d240 were also significantly depolarized compared with their counterparts at other time points (d200–210, p value = 0.69; d220–230, p value = 0.07; d230–240, p value = 0.15; d250–260, p value = 0.0015; d300–310, p value = 0.89).
