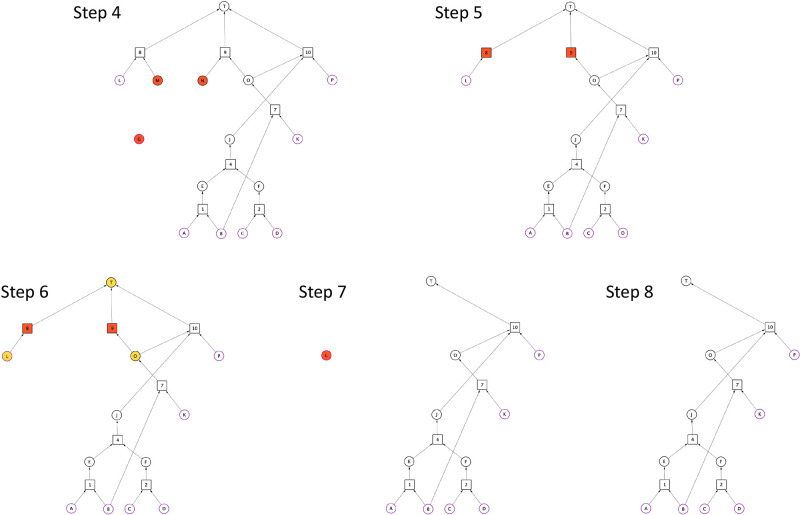
Figure 2.
Synthesis Graph Pruning algorithm – part 2. Reaction nodes are represented by squares, whereas substance nodes, by circles. Red nodes are subject to elimination, whereas yellow ones are subject to inspection to be assessed by the elimination criteria (see: Def 9). Substance nodes of purple outline indicate starting materials. The target molecule is denoted by “T”.

