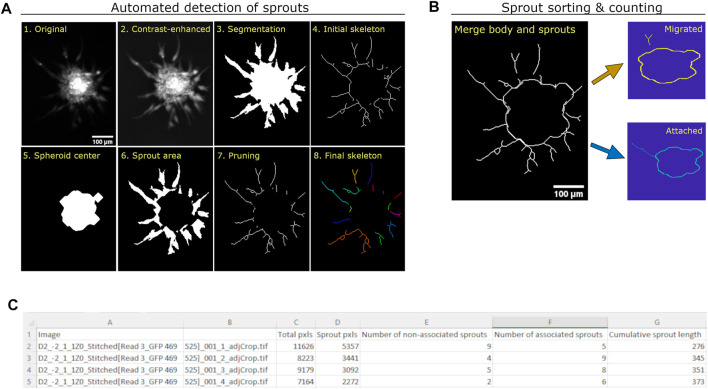
FIGURE 2.
Quantification method of angiogenic sprouting from HUVEC spheroids. (A) Images demonstrating the automatic generation of masks and skeletons used to quantify total area, sprout area, and cumulative sprout length from each spheroid. The original image (1) is intensity adjusted using adaptive histogram equalization (2), and segmented using a combination of Sobel segmentation, convolution, and adaptive thresholding to generate a spheroid mask (3), as described before (Kannan et al., 2016). The image was then reduced to an initial skeleton using a skeletonization method (4). After the spheroid center (5) and sprout area (6) were identified, the center was subtracted from the sprout skeleton to exclude extensions found in the spheroid center (7). Small extensions were then removed to generate the final sprout skeleton (8). (B) Images demonstrating the counting of individual sprouts as migrated or attached. Each sprout in the skeleton is assessed as to whether it intersects with the skeleton of the center. If a sprout intersects with the center, it is considered “attached”; otherwise, it is considered “migrated”. (C) View of output csv file from automated algorithm.

