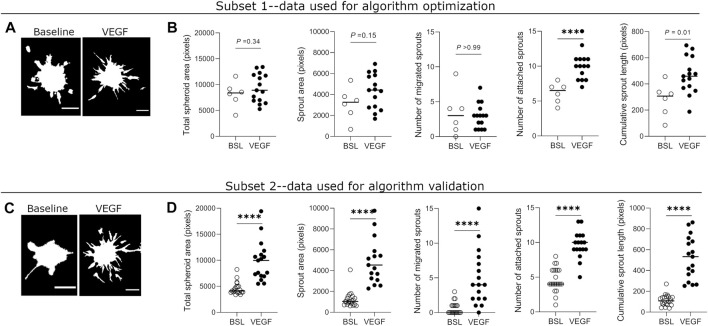
FIGURE 4.
Quantification of sprouting parameters measured by automated method in optimization and validation datasets. (A) Representative binary masks of spheroid sprouting in baseline and VEGF-treated (25 ng/ml) conditions from the optimization dataset. VEGF = vascular endothelial growth factor. (B) Quantification of five sprouting parameters in untreated and VEGF-treated spheroids from the optimization dataset. (C) Binary mask images of spheroid sprouting in baseline and VEGF-treated (25 ng/ml) conditions from the validation dataset. (D) Quantification of sprouting parameters in untreated and VEGF-treated spheroids from validation dataset. Each data point represents value from one spheroid, and the horizontal line indicates the median value of the group. Data was collected from one biological experiment and divided into two subsets–one for optimization and one for validation of the automated method. Statistical significance for total spheroid area, sprout area, and cumulative sprout length was determined by Student’s t-test with Welch’s correction (unpaired, two-tailed, α = 0.05), while that for number of migrated sprouts and attached sprouts was determined by Mann-Whitney test (non-parametric, unpaired, two-tailed, α = 0.05). Adjusted p-values (corrected for multiple testing) are indicated. Scale bars = 100 μm.

