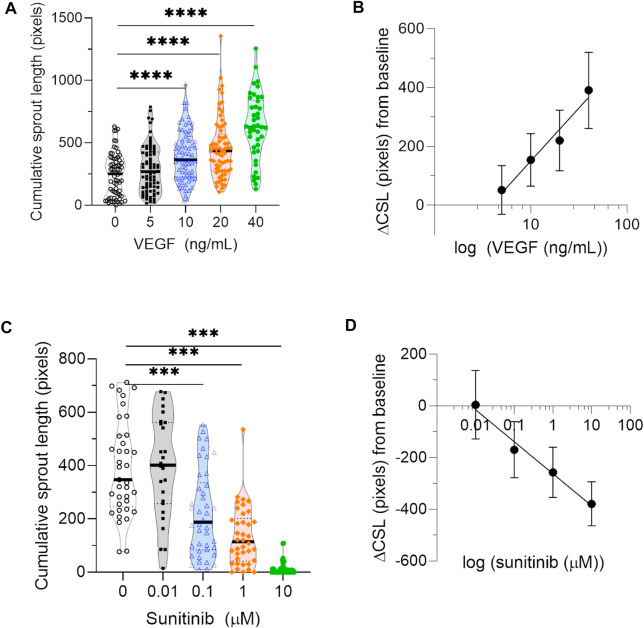
FIGURE 5.
Sensitivity of automated quantification to pro- and anti-angiogenic compounds. (A) Quantification of cumulative sprout length measured in spheroids treated with a range of concentrations of the proangiogenic compound VEGF from three independent experiments. Each data point represents one spheroid. Statistical significance was determined by Browne-Forsythe one-way ANOVA, followed by multiple testing correction using Dunnett T3 (two-tailed, α = 0.05); asterisks designate adjusted p-values (corrected for multiple testing) as follows: ***p < 0.001. (B) The average difference in cumulative sprout length (ΔCSL) between VEGF-treated conditions and baseline, calculated for a range of VEGF concentrations. Data points represent average value in that group from all three biological repeats, and error bars represent the 95% confidence interval. (C) Quantification of cumulative sprout length measured in spheroids treated with a range of concentrations of the antiangiogenic inhibitor sunitinib from two independent experiments. Since sunitinib targets VEGF-mediated signaling by inhibiting VEGF receptor 2, sunitinib treatment was performed in the presence of 20 ng/ml VEGF for all conditions. Each data point represents one spheroid. Statistical significance was determined by Browne-Forsythe one-way ANOVA, followed by multiple testing correction using Dunnett T3 (two-tailed, α = 0.05); asterisks designate adjusted p-values (corrected for multiple testing) as follows: ****p < 0.0001. (D) The average difference in cumulative sprout length (ΔCSL) between sunitinib-treated conditions and baseline, calculated for a range of sunitnib concentrations. Data points represent average value in that group from both biological repeats, and error bars represent the 95% confidence interval.

