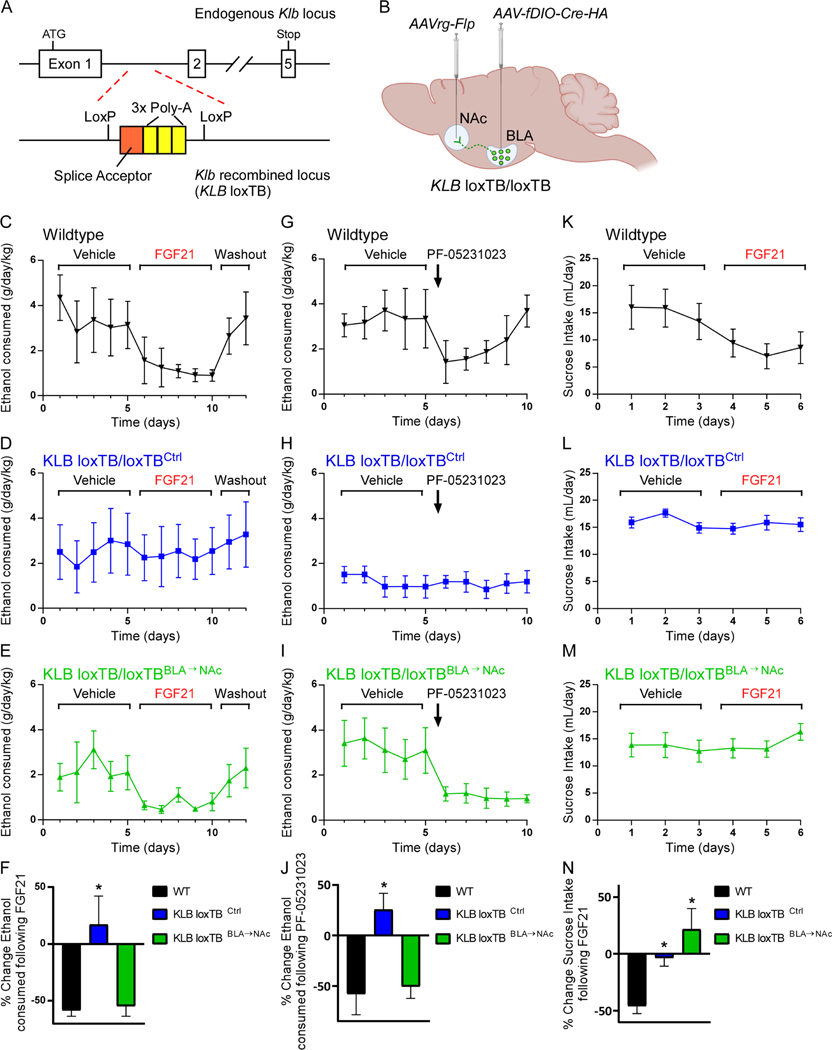
Figure 4. KLB expression in BLA→NAc projection neurons is necessary and sufficient for suppression of alcohol consumption by FGF21 and PF-05231023.
(A) Schematic illustrating placement of a transcriptional blocking sequence (splice acceptor (orange) followed by 3x poly A tail sequence (yellow)) in the intronic region between the 1st and 2nd exon of Klb flanked by loxP sites to generate KLB loxTB mice.
(B) Schematic illustrating the dual recombinase strategy used to return endogenous KLB expression specifically to BLA→NAc projecting neurons using an AAVrg-Flp expressing virus injected into the NAc and an AAV virus expressing a Flp-dependent HA-tagged version of Cre (AAV-fDIO-Cre-HA) injected into the BLA.
(C-E) Ethanol (EtOH) consumption (g/day/kg) in wildtype mice (black, WT), KLB loxTB control mice (blue, KLB loxTBCtrl, KLBloxTB/loxTB mice which received AAV-fDIO-Cre-HA in the BLA, but AAVrg-GFP in the NAc instead of AAVrg-Flp), and mice in which endogenous KLB expression was returned to BLA→NAc projecting neurons (green, KLB loxTBBLA→NAc; KLBloxTB/loxTB mice which received AAV-fDIO-Cre-HA in the BLA, and AAVrg-Flp in the NAc) during daily vehicle administration followed by daily FGF21 administration (IP, 1 mg/kg) as indicated by the brackets above the plots followed by a washout period.
(F) Percent (%) change in EtOH consumption comparing FGF21 treatment period relative to the vehicle treated period for each group (n = 5 WT mice, 12 KLB loxTBCtrl, 9 KLB loxTBBLA→NAc, one-way ANOVA w/Dunnett’s multiple comparison’s test, *=P<0.05 relative to WT mice).
(G-I) EtOH consumption in WT, KLB loxTBCtrl mice, and KLB loxTBBLA→NAc during daily vehicle administration followed by a single injection of PF-05231023 (IP, 10 mg/kg) as indicated by the brackets and arrow, respectively, above the plots.
(J) Quantification of the percent (%) change in EtOH consumption comparing 1 day following PF-05231023 treatment relative to the vehicle treated period for each group (n = 5 WT mice, 12 KLB loxTBCtrl, 9 KLB loxTBBLA→NAc, one-way ANOVA w/Dunnett’s multiple comparison’s test, *=P<0.05 relative to WT mice).
(K-M) Sucrose consumption (mL/day) in WT, KLB loxTBCtrl mice, and KLB loxTBBLA→NAc during daily vehicle administration followed by daily FGF21 administration (IP, 1mg/kg) as indicated by the brackets above the plots.
(N) Quantification of the percent (%) change in sucrose consumption comparing FGF21 treatment period relative to the vehicle treated period for each group (n = 5 WT mice, 12 KLB loxTBCtrl, 9 KLB loxTBBLA→NAc, one-way ANOVA w/Holm-Sidak’s multiple comparison’s test, *=P<0.05 for KLB loxTBBLA→NAc mice relative to WT mice).
Data are presented as mean ± S.E.M.
See also Figure S3.

