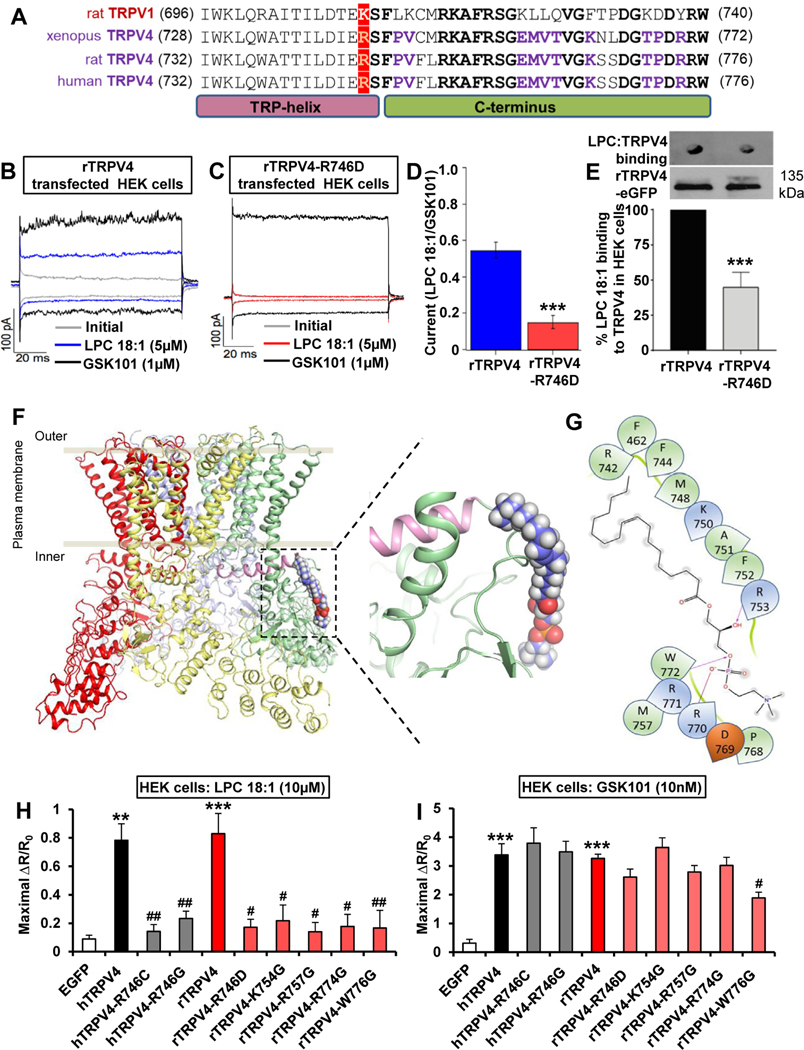
Figure 3.
LPC activates TRPV4 directly via a C-terminal binding pocket. (A) Sequence alignment of the C-terminus comprising the TRP helix of rTRPV1, Xenopus TRPV4, rTRPV4, and hTRPV4. Note conservation of positive charge at position K710 for TRPV1, R742 for Xenopus TRPV4, and R746 for rTRPV4 and hTRPV4 (in red). Identical residues, shared between TRPV1 and TRPV4, C-terminal of this key residue are bolded in black. Identical residues, conserved only in vertebrate TRPV4, C-terminal to R742/R746 are bolded in purple. (B–E) Representative currents from excised inside-out membrane patches in (B) rTRPV4-transfected HEK cells or (C) rTRPV4(R746D) were obtained without agonist stimulation (gray), in the presence of LPC(18:1) (blue, red) or TRPV4 agonist GSK1016790A (GSK101, black). Traces shown were obtained at −60 and +60 mV. (D) There was a significant current reduction in rTRPV4(R746D)-transfected HEK cells when activated with LPC(18:1). Data were normalized to activation with GSK101. ***P < .001 vs rTRPV4 (n = 5 cells/group). (E) In vitro interaction assays show significantly reduced binding of LPC(18:1) to rTRPV4(R746D). eGFP, enhanced green fluorescent protein. ***P < .001 vs rTRPV4 (n = 3 assays/ group). (F and G) Based on alignment and established TRPV4 structure (crystal, cryo-electron microscopy), derived from Xenopus tropicalis TRPV4, note our structural model that explains binding of LPC(18:1) to a series of positively charged AA750–772; with R742 as a postulated structural determinant of this binding. The left rendering shows the TRPV4 tetramer (each subunit is in a different color) as it integrates into the plasma membrane, with the green subunit binding of LPC(18:1). The right schematic shows binding of LPC(18:1) to the TRPV4 C-terminus at higher resolution. (H and I) The Ca2+ signal induced by LPC(18:1) was drastically reduced in TRPV4-transfected HEK cells (TRPV4 mutations R746C, R746G, R746D, K754G, R757G, R774G, and W776G). In contrast, the GSK101-induced Ca2+ signal was not significantly disrupted, except a moderate reduction with mutation W776G. R/R0, fraction of the increase of the ratio over the baseline ratio divided by baseline ratio. **P < .01 and ***P < .001 vs EGFP, #P < .05 and ##P < .01 vs hTRPV4 or rTRPV4 (n ≥ 120 cells recorded/condition). Two-tailed t test for D and E, 1-way analysis of variance with Tukey’s post hoc test for H and I. The error bars indicate the standard error of the mean.

