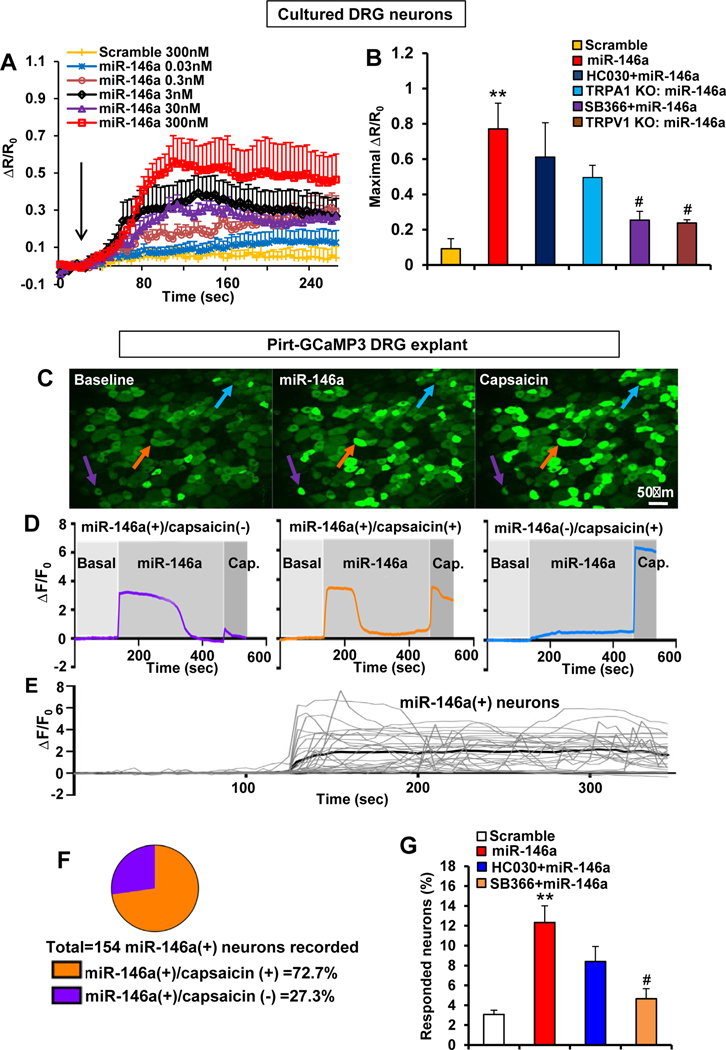
Figure 6.
miR-146a activates primary sensory neurons in a TRPV1- but not TRPA1-dependent manner. (A) miR-146a induced Ca2+ influx in cultured DRG neurons (n ≥ 190 neurons recorded/concentration) in a dose-dependent manner (arrow: miR-146a or scramble stimulation). R/R0 is the fraction of the increase of a given ratio over baseline ratio divided by baseline ratio. (B) miR-46a (300 nmol/L) induced Ca2+ influx that was significantly reduced by pretreatment with TRPV1 inhibitor SB366791 (10 μmol/L) and in neurons (n ≥ 190 neurons recorded/concentration) from Trpv1 KO mice but was not significantly altered by TRPA1 inhibitor HC030031 (10 μmol/L) or in neurons from Trpa1 KO mice. R/R0 is the fraction of the increase of the ratio over the baseline ratio divided by baseline ratio **P < .01 vs scramble (300 nmol/L) and #P < .05 vs miR-146a. (C) Representative Ca2+ imaging of GCaMP3-expressing DRG neurons in an ex vivo preparation illustrates the increased Ca2+ signal (arrows; colors matching the Ca2+ transients in D) after stimulation with miR-146a (300 nmol/L) and capsaicin (1 μmol/L). (D) Representative Ca2+ traces of miR-146a(+)/capsaicin(−), miR-146a(+)/capsaicin(−), or miR-146a(−)/capsaicin(+) DRG neurons. F/ F0 is the ratio of fluorescence difference to baseline. (E) Representative Ca2+ traces of a population of DRG neurons responsive to miR-146a. (F) Of 1250 neurons recorded, 154 were responsive to miR-146a, and 72.7% of miR-146a–responsive neurons were also capsaicin responsive. (G) Increased percentage of total DRG neurons responding to miR-146a (300 nmol/L) was significantly reduced by SB366791 (10 mmol/L) but not by HC030031 (10 mmol/L). **P < .01 vs scramble-control (300 nmol/L) and #P < .05 vs miR-146a (n = 4–9 DRG explants/group (1 explant /mouse). One-way analysis of variance with Tukey’s post hoc test was used for B and G. The error bars indicate the standard error of the mean.

