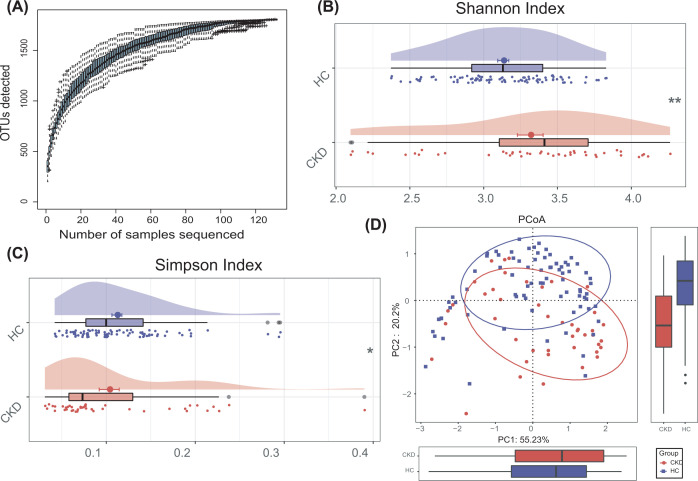
Figure 2. Oral microbial diversity of patients with CKD was increased in the discovery phase.
(A) The Specaccum species accumulation curses (Figure 2A) indicated that OUT richness approached saturation in all samples, and shown adequate sampling. (B,C) The cloudplots show that microbiomes diversity differences according to the Shannon index and Simpson index between the CKD (n=44) and HCs (n=88). Plot parameters, the ‘bold dot’ symbol represents median value, the upper and lower ranges of the scatter in the figure represent 25% and 75%, respectively. (D) PCoA for diversity clustering analysis of CKD (n=44) and HCs (n=88) oral microorganisms. Each symbol represents a sample (red, CKD; blue, HC). *P<0.05; **P<0.01 and ***P<0.001; CKD, chronic kidney disease; HC, healthy control; PCoA, Principle co-ordinates analysis.

