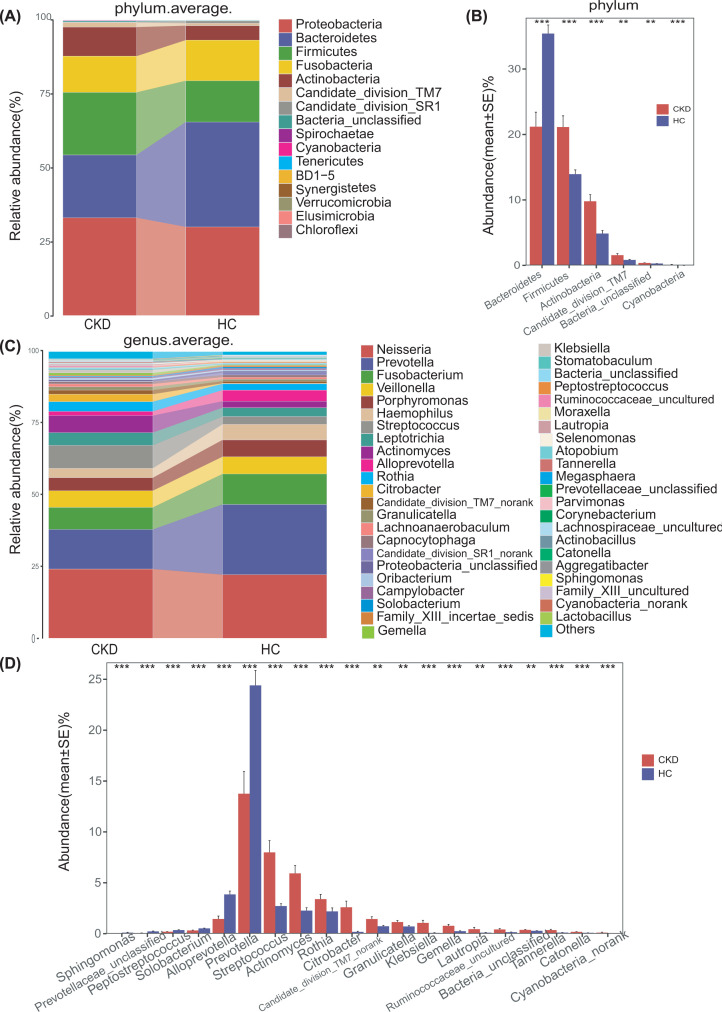
Figure 4. Differences in species levels of CKD (n=44) and HCs (n=88) oral microorganisms.
(A,C) The barplots show the comparison of the microbiome's relative abundance at the level of phylum (A) and genus (C) between CKD and HCs, respectively. The upper right corner is marked with a kind of bacteria represented by different colors, which is consistent with the main picture. (B) Five phyla were significantly enriched, while 1 phylum were significantly reduced in CKD (n=44) versus HCs (n=88). (D) Fourteen genera were significantly enriched, while 6 genera were significantly reduced in CKD (n=44) versus HCs (n=88). Wilcoxon test was used to compare significant differences between groups and FDR was calculated [Supplementary Data S5-6 (phylum) and S7-8 (Genus)]; Significant correlations by *Q<0.05; **Q<0.01 and ***Q<0.001(red, CKD; blue, HCs); CKD, chronic kidney disease; HC, healthy control.

