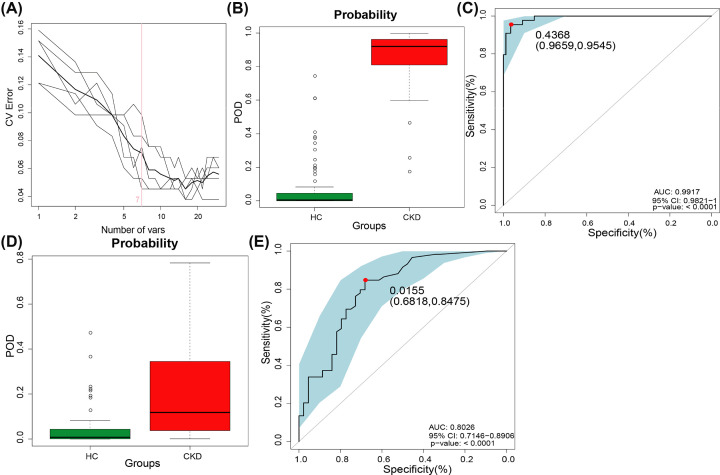
Figure 7. Diagnostic potential of oral microbiome markers in CKD patients.
(A) The 7 OTUs markers were selected as the optimal marker set by random forest models. (B) The POD value was remarkably increased in CKD (n=44) versus HCs (n=88) in the discovery phase. (C) The POD index achieved an AUC value of 0.9917 with 95% CI of 0.9821 to 1 between CKD (n=44) versus HCs (n=88) in the discovery phase (P<0.001). (D) The POD values were increased in CKD (n=59) compared with HC (n=44) (P<0.001). (E) The POD index achieved an AUC value of 0.8475 with 95% CI of 0.7146 to 0.8906 between CKD (n=59) versus HCs (n=44) in the validation phase (P<0.001) (Supplementary Data S11–S14); AUC, area under the curve; CI, confidence interval; CKD, chronic kidney disease; HC, healthy control; POD, probability of disease; ROC, receiver operating characteristic.

