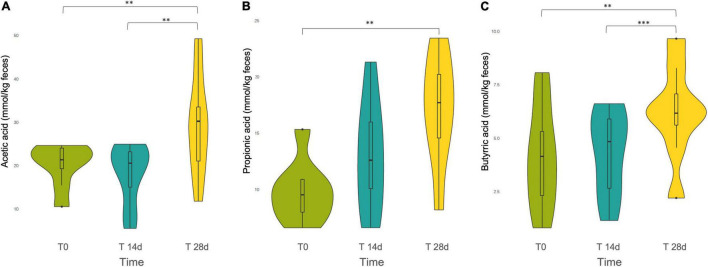
FIGURE 4.
Violin plot of the short chain fatty acids (SCFAs) (A) Acetic acid, (B) Propionic acid, and (C) Butyric acid released during the tannin intervention, at different time points: T0, T14d, and T28d. ** and *** indicates statistically significant differences by ANOVA and Bonferroni post-hoc test: **p < 0.01, ***p < 0.001.

