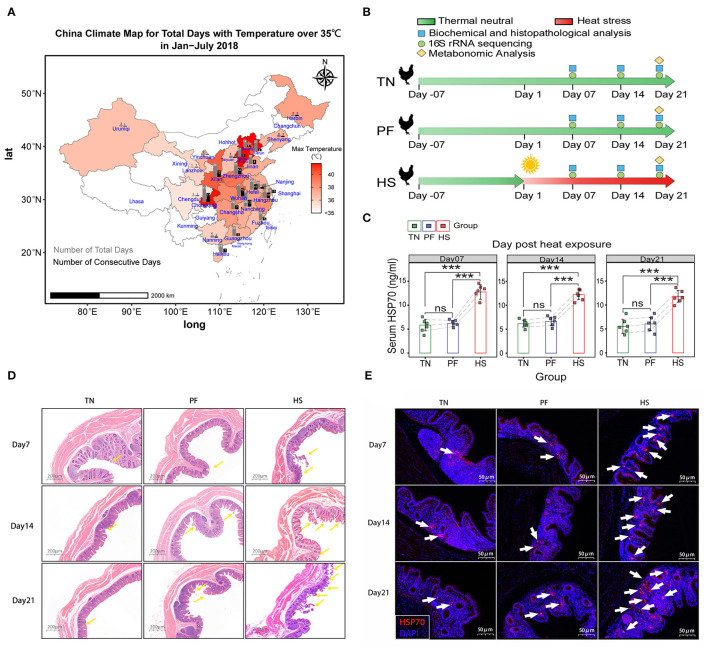
Figure 1.
Establishment of chronic heat exposure models of growing hens. (A) China Climate Map for Total Days with Temperature over 35°C in January–July 2018. Colors represent the max temperatures among different provinces shown in the scale bar next to the charts. The gray bars represent the number of the total days, and black bars represent the number of consecutive days. (B) An overview of the schematic diagram for the time design of the experiment, before heat exposure (day-14), beginning of the heat exposure (Day 1), sampling days 7, 14, and 21. (C) Bar plots showing the level of HSP70 in serum among the TN, PF, and HS groups. All results are expressed as mean ± SD of eight hens in each group. *, **, and *** represent statistical significance at p < 0.05, p < 0.01, and, p < 0.001 levels. ns, denotes no significant difference was found in related groups. (D) Representative hematoxylin–eosin-stained images of (original magnification, 50×) of hen cecal tissue at different time points. (E) Representative images of immunofluorescence staining for HSP70 in cecal tissues.

