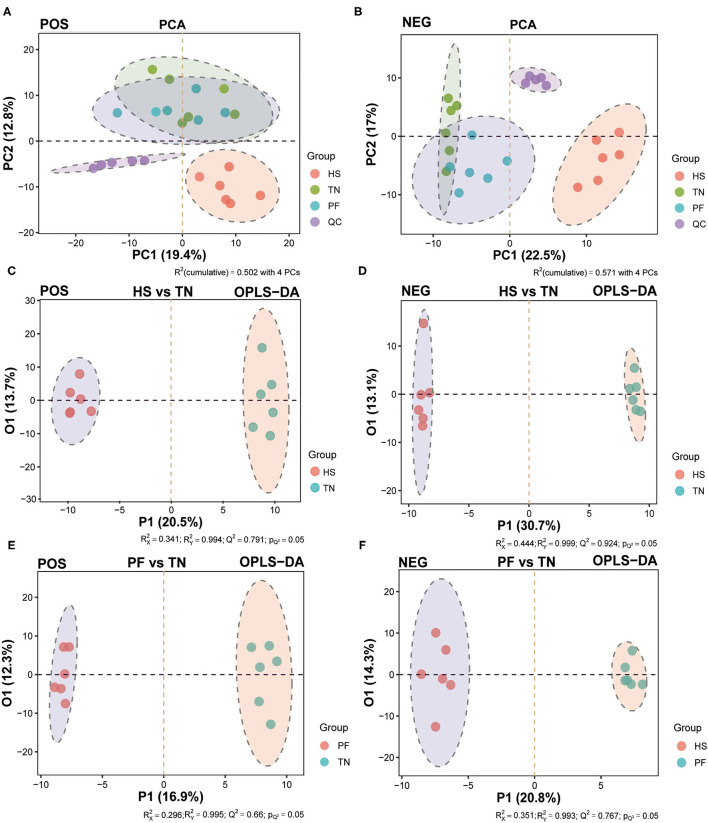
Figure 6.
Multivariate analysis of the untargeted UHPLC-QTOF/MS metabolomics. The PCA score plots display the variance of positive (A) and negative (B) ions among TN, PF, and HS groups. The OPLS-DA score chart of serum metabolite analyzes the variance of positive (C) and negative (D) ions between the HS and TN groups, and the variance of positive (E) and negative (F) ions between the PF and TN groups.

