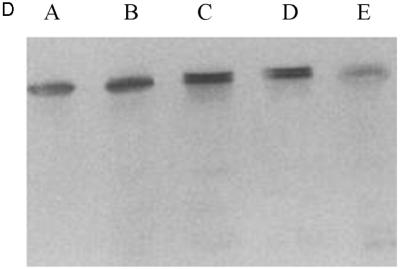
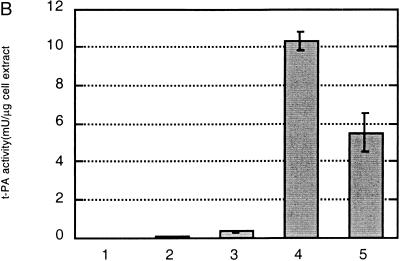
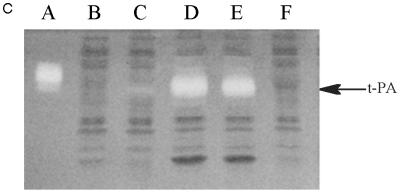
FIG. 1.


Expression of tPA in E. coli. (A) Fibrin plate analysis of tPA activity. Equal amounts of soluble protein from each culture were spotted on the fibrin plate. Lanes: A, pBAD-stII-tPA alone; B, pBAD-stII-tPA + pLppsOmpArPDI; C, pBAD-stII-tPA + pSE380dsbA; D, pBAD-stII-tPA + pSE420dsbC; E, pBAD-stII-tPA + pSE380dsbAC. (B) The specific rate of plasminogen activation in soluble fractions from cells harvested 3 h after induction was measured by the indirect chromogenic assay. tPA activities are reported as milliunits (mU) per microgram of total cell protein. Columns: 1, pBAD-stII-tPA alone; 2, pBAD-stII-tPA + pLppsOmpArPDI; 3, pBAD-stII-tPA + pSE380dsbA; 4, pBAD-stII-tPA + pSE420dsbC; 5, pBAD-stII-tPA + pSE380dsbAC. (C) Zymography of E. coli soluble fractions. DsbC is evident as an intense Coomassie blue-stained band. Lanes: A, single-chain tPA standard; B, pBAD-stII-tPA alone; C, pBAD-stII-tPA/pSE380dsbA; D, pBAD-stII-tPA/pSE420dsbC; E, pBAD-stII-tPA/pSE380dsbAC; F, pBAD-stII-tPA/pLppsOmpArPDI. (D) Western blot of tPA expression in different strains. Lanes: A, pBAD-stII-tPA alone; B, pBAD-stII-tPA + pSE380dsbA; C, pBAD-stII-tPA + pSE420dsbC; D, pBAD-stII-tPA + pSE380dsbAC; E, pBAD-stII-tPA + pLppsOmpArPDI.


