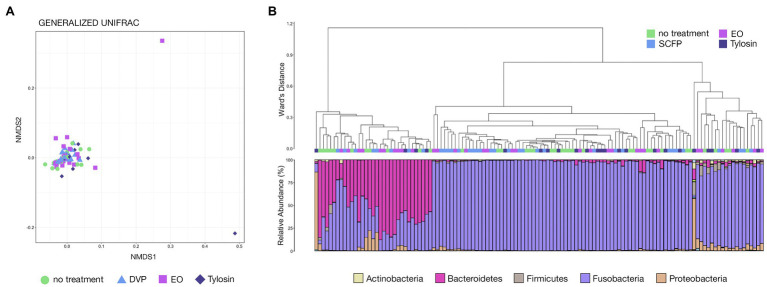
Figure 3.
(A) Non-metric multidimensional scaling of generalized UniFrac distances illustrating differences in microbial community structure between treatment groups in the Texas trial. The NMDS demonstrates clustering of 16S rRNA gene sequences from LA microbial communities from animals given the control diet, and diet supplemented with SCFP, essential oil (EO), or tylosin. (B) The relatedness of LA microbial communities from the Texas trial based on normalized ASVs. Hierarchal clustering was performed on generalized UniFrac distances using Ward’s agglomeration method. Green boxes represent LA communities from animals fed the control diet, blue boxes represent LA communities from animals given SCFP-supplemented diet, light purple boxes represent LA communities from animals given EO-supplemented diet, and dark purple boxes represent LA communities from animals given tylosin-supplemented diet. The bar plot illustrates the relative abundance of microbial phyla within each individual sample. The five most abundant phyla across all samples are displayed in the legend.

