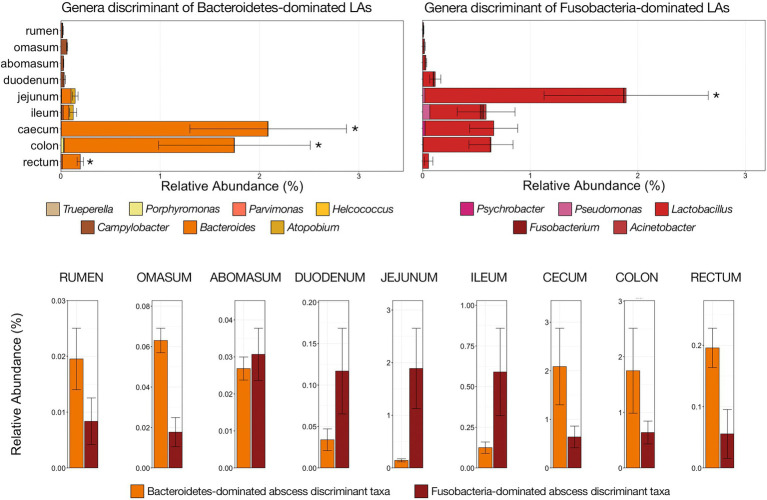
Figure 6.
Bar plots demonstrating the relative abundances of all genera discriminant of LA microbial communities classified as high Bacteroidetes (left; shades of orange) and high Fusobacteria (right; shades of red) with nine locations of the bovine gastrointestinal tract (GIT). All genera detected are listed in the legends. Error bars represent the SEM. Significant differences between GIT locations are noted by an asterisk for the aggregate relative abundance of discriminant genera of high Bacteroidetes communities (Pairwise Wilcoxon rank-sum with Benjamini–Hochberg correction, p < 0.05, n = 34–56) and high Fusobacteria communities (Pairwise Wilcoxon rank-sum with Benjamini–Hochberg correction, p < 0.05, n = 34–56). Bar plot demonstrating the aggregate abundance of genera discriminant of high Bacteroidetes or high Fusobacteria LA communities at each of the nine GIT locations investigated sorted from left (proximal GIT) to right (distal GIT). Error bars represent the SEM.

