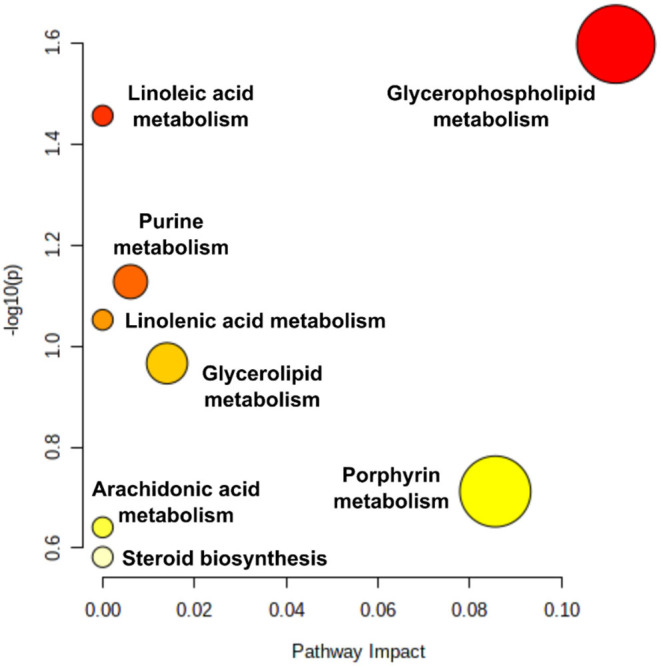
Figure 3.

Pathway impact: pathway analysis based on enrichment analysis procedures, identifying the most relevant metabolic pathways via pathway impact and adjusted p. The figures were generated using MetaboAnalyst 4.0 (www.metaboanalyst.ca). Pathway impact here represents a combination of the centrality and pathway enrichment results; higher impact values represent the relative importance of the pathway; the size of the circle indicates the impact of the pathway while the color represents the significance (the more intense the red color, the lower the p).
