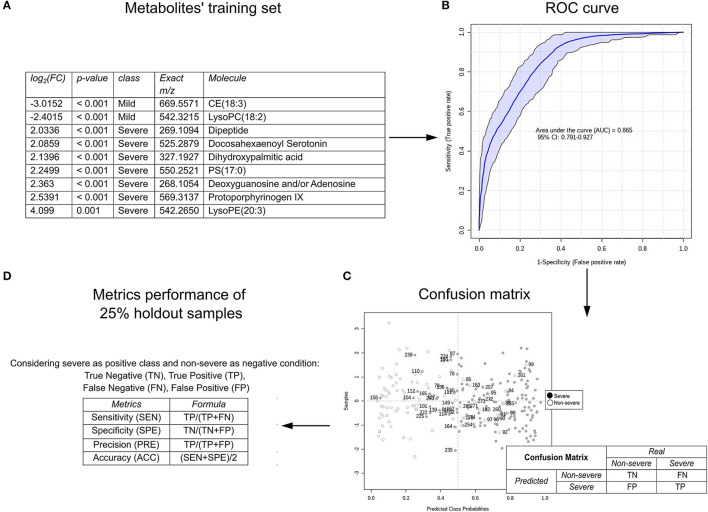
Figure 4.
An example of the prediction of SARS-CoV-2 infection severity according to the metabolomic profile of the plasma of the COVID-19 patients using the receiver operating characteristic (ROC) curve; (A) set of metabolites used for training; (B) ROC curve evidenced by the area under the curve (AUC) and CI 95%; (C) confusion matrix for calculating the proportion of false negatives, false positives, true negatives, and true positives; (D) performance metrics as sensitivity, specificity, accuracy, and precision. The figures were generated via MetaboAnalyst software v 4.0 (www.metaboanalyst.ca).

