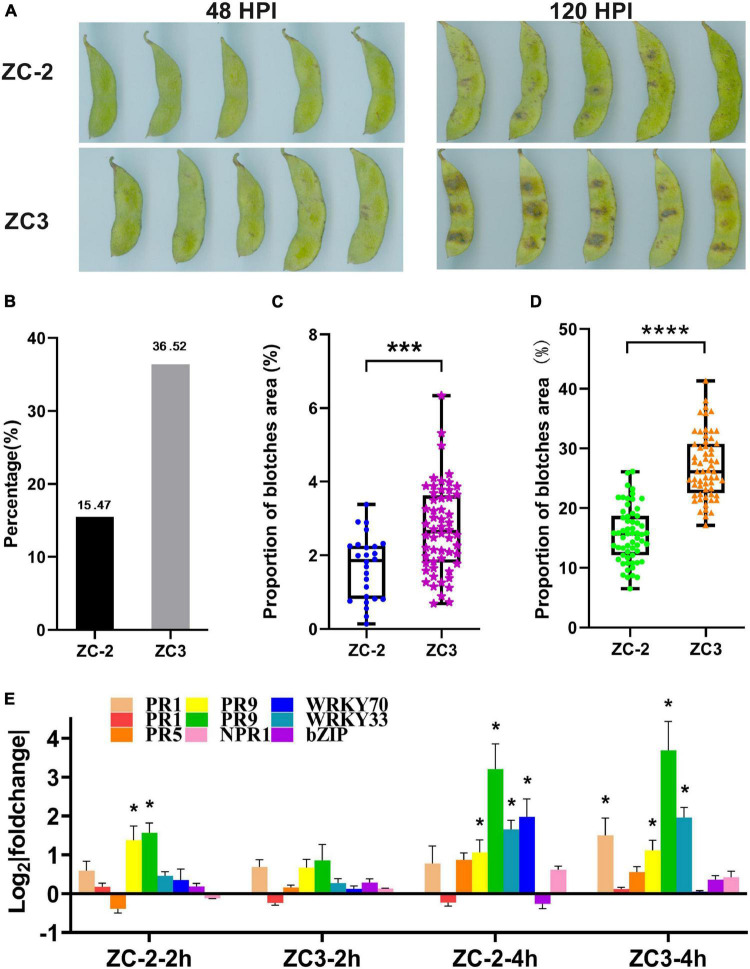
FIGURE 1.
(A) Symptoms of anthracnose on pods of soybean lines ZC-2 and ZC3 at 2 and 5 days after inoculation with Colletotrichum truncatum. (B) Statistics on the proportion of pods with anthracnose blotches at 2 days after inoculation. (C) Lesion area as a percentage of total pod area for each line at 2 days after inoculation (n = 26, 59). ***p < 0.001. (D) Lesion area as a percentage of total pod area for each line at 5 days after inoculation (n = 60). ****p < 0.0001. (E) Expression levels of nine disease-responsive genes detected by quantitative real-time PCR. The y-axis is the log2 expression fold change and the x-axis represents the comparison groups. *p < 0.05. PR1, pathogenesis-related protein 1 (Glyma.15G062400, Glyma.15G062500); PR5, thaumatin-like protein (Glyma.10G061000); PR9, peroxidase (Glyma.10G222400), (Glyma.09G277800); WRKY33 (Glyma.01G128100); WRKY70 (Glyma.04G223300); bZIP, basic region-leucine zipper transcription factor (Glyma.05G122400); NPR1, non-expressor of pathogenesis-related genes 1 (Glyma.15G127200).

