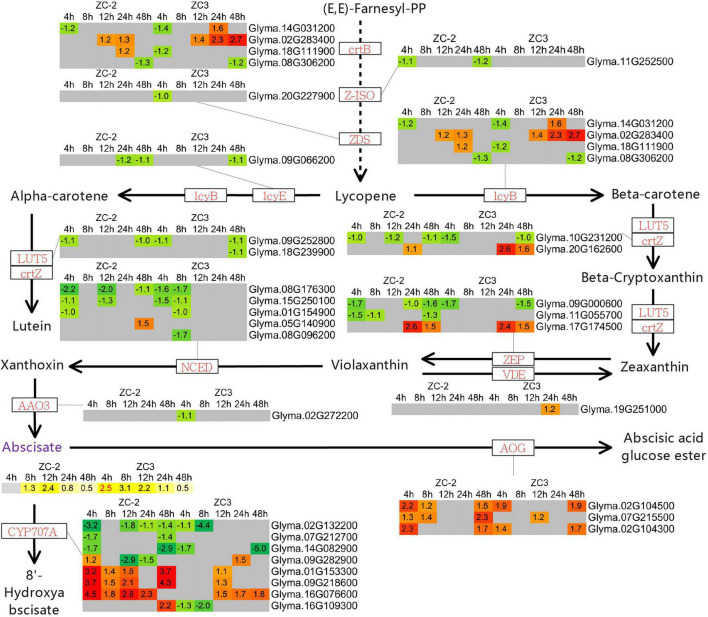
FIGURE 10.
Schematic diagram of carotenoid biosynthesis with heatmaps of the associated differentially expressed genes (DEGs) and differentially accumulated metabolites (DAMs). The log2 expression fold change is color-coded in each box: red and yellow indicate up-regulated DEGs and DAMs, and green and blue indicate down-regulated DEGs and DAMs, respectively. Each row represents a DEG or DAM; the columns represent each sampling time point [4, 8, 12, 24, and 48 h post-inoculation (HPI)] for ZC-2 and ZC3. Abbreviations for DEGs are in red font and those for DAMs are in purple font.

