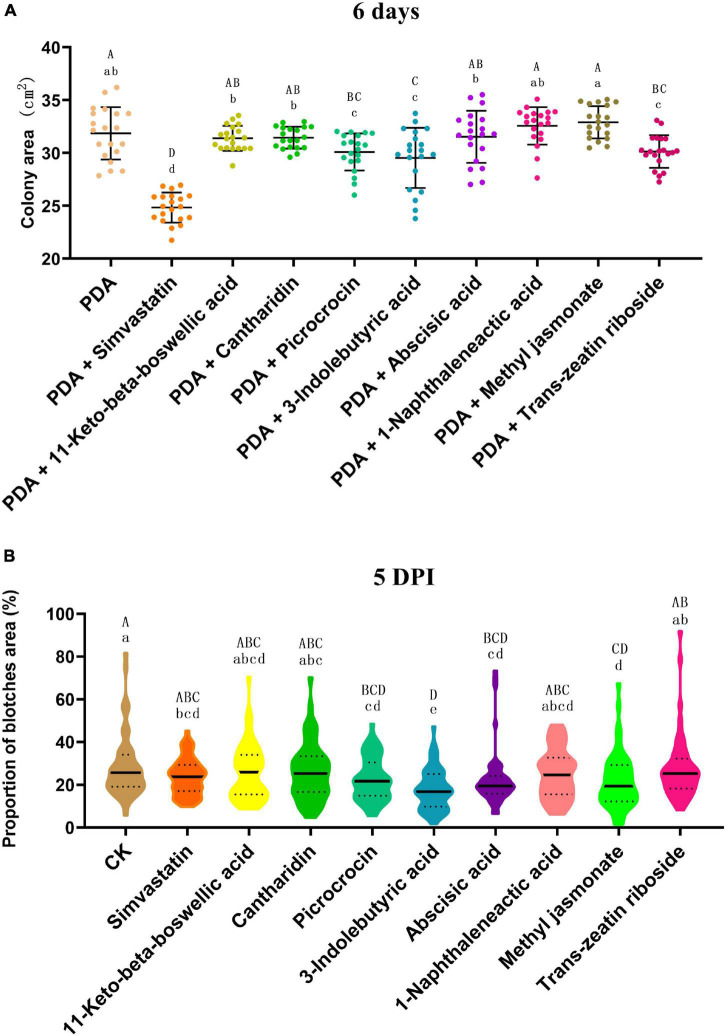
FIGURE 12.
(A) Inhibitory effects of different terpenoids and plant hormones on the growth of Colletotrichum truncatum. The individual values of colony areas and the means ± SD are shown. The acolony areas were scanned and calculated with the LA-S analysis system. Different upper-case and lower-case letters indicate statistical significance at p < 0.05 and p < 0.01, respectively, between individual compounds (Tukey’s HSD test, n = 20). (B) Effects of different terpenoids and plant hormones on the resistance of soybean pods to anthracnose. Violin plots of the proportion of the total blotch area and means ± SD are shown. The blotches were scanned and areas calculated with the LA-S analysis system. Different upper-case and lower-case letters indicate statistical significance at p < 0.05 and p < 0.01, respectively, between individual compounds (Tukey’s HSD test, n = 50).

