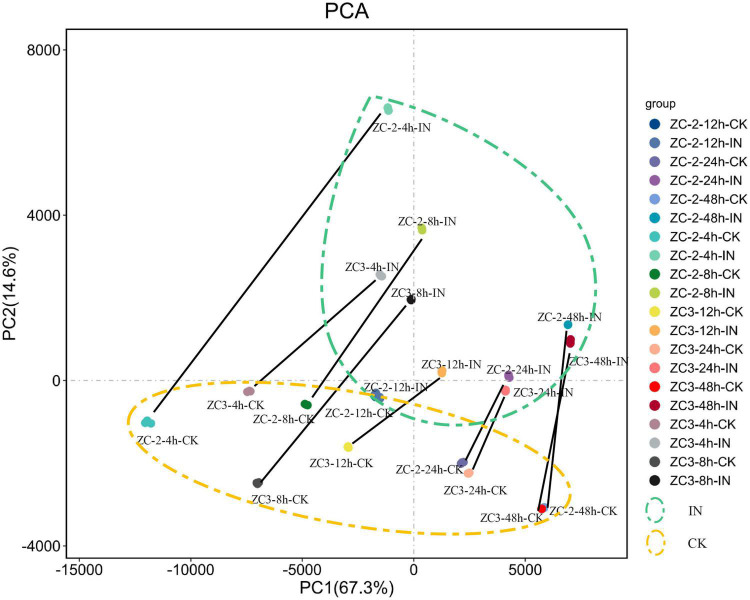
FIGURE 2.
Principal component analysis scatterplot of the first and second principal components (PC1 and PC2, respectively) for gene transcripts detected from pods of soybean lines ZC-2 and ZC3 infected with Colletotrichum truncatum and from non-infected controls (CK) at five time points [4, 8, 12, 24, and 48 h post-inoculation (HPI)] after inoculation. Each sample comprised three biological replicates. All inoculated samples are enclosed by a green dashed ellipse and all control samples are enclosed by an orange dashed ellipse. Each control sample and its corresponding inoculated sample are connected by a black line.

