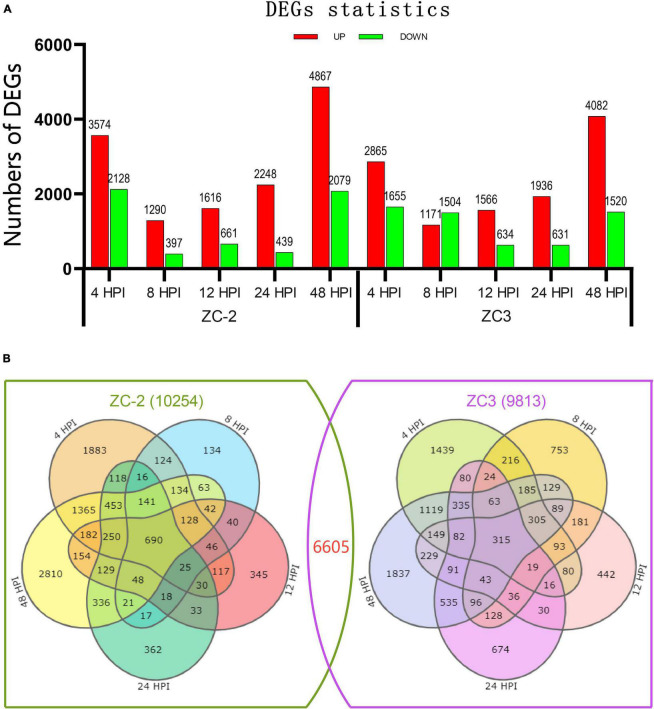
FIGURE 3.
(A) Number of significantly differentially expressed genes (DEGs) detected from pods of soybean lines ZC-2 and ZC3 infected with Colletotrichum truncatum. The transcriptome was sampled at five time points after inoculation. The DEGs are shown in red (up-regulated) or green (down-regulated). (B) Venn diagram of the DEGs for each line.

