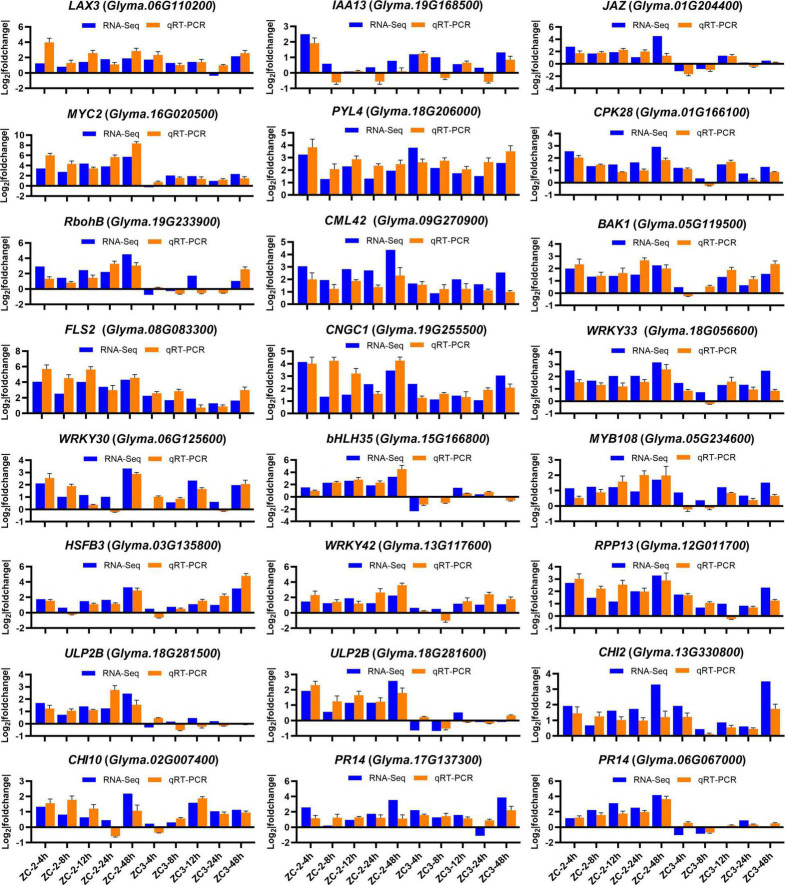
FIGURE 4.
Expression levels of 24 genes detected by RNA-sequencing and quantitative real-time PCR. The y-axis is the log2 expression fold change and the x-axis represents the comparison groups. LAX3, auxin transporter-like protein 3; IAA13, auxin-responsive protein IAA13; JAZ, jasmonate ZIM domain-containing protein; PYL4, abscisic acid receptor PYL4; CPK28, calcium-dependent protein kinase 28; RobhB, respiratory burst oxidase protein B; CML42, calcium-binding protein 42; BAK1, BRASSINOSTEROID INSENSITIVE 1-associated receptor kinase 1; FLS2, LRR receptor-like serine/threonine-protein kinase FLS2; CNGC1, cyclic nucleotide-gated ion channel 1; HSFB3, heat stress transcription factor B-3; RPP13, disease resistance protein RPP13; ULP2B, disease resistance protein; CHI2, chitinase 2; CHI10, chitinase 10; PR14, lipid transfer-like protein.

