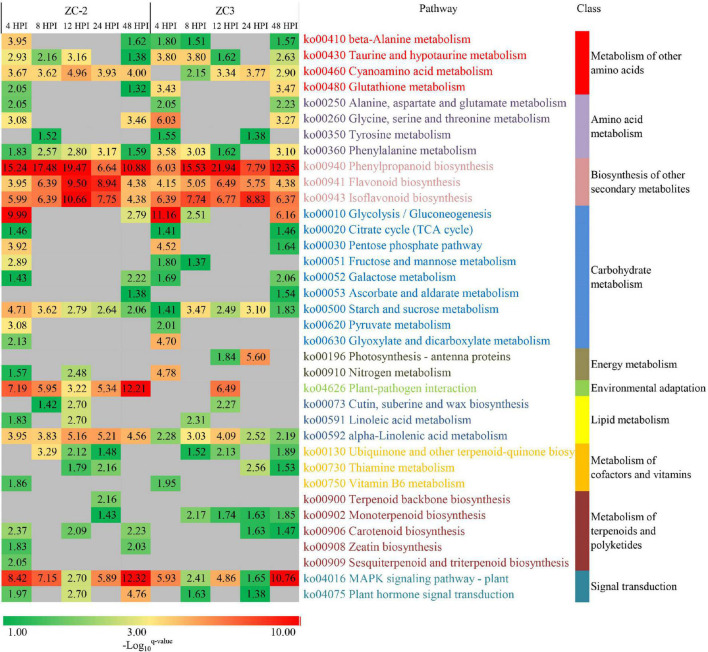
FIGURE 5.
Heatmap of the enriched KEGG pathways in pods of soybean lines ZC-2 and ZC3 infected with Colletotrichum truncatum. The −log10 q-value is color-coded, from green to red, to indicate low to high degree of enrichment. Each row represents an enriched KEGG pathway; the columns represent each sampling time point [4, 8, 12, 24, and 48 h post-inoculation (HPI)] for ZC-2 and ZC3.

