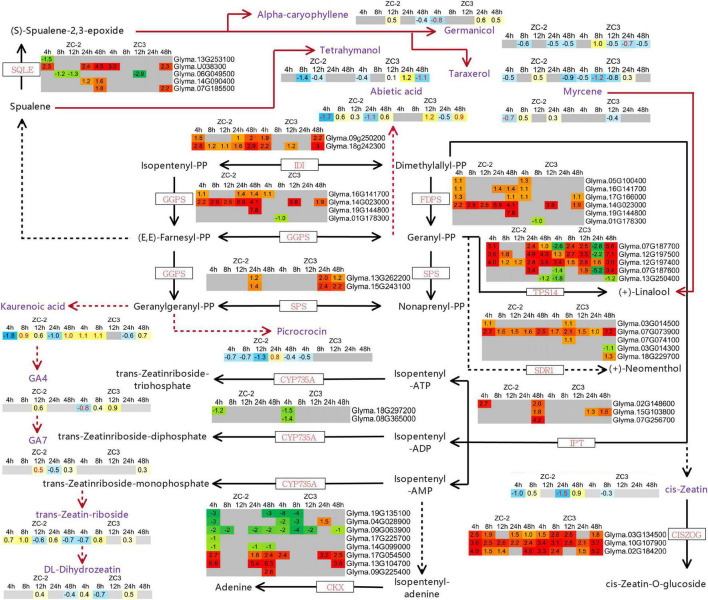
FIGURE 9.
Schematic diagram of terpenoid backbone biosynthesis and zeatin biosynthesis with heatmaps of the associated differentially expressed genes (DEGs) and differentially accumulated metabolites (DAMs). The log2 expression fold change is color-coded in each box: red and yellow indicate up-regulated DEGs and DAMs, and green and blue indicate down-regulated DEGs and DAMs, respectively. Each row represents a DEG or DAM; the columns represent each sampling time point [4, 8, 12, 24, and 48 h post-inoculation (HPI)] for ZC-2 and ZC3. Abbreviations for DEGs are in red font and those for DAMs are in purple font.

