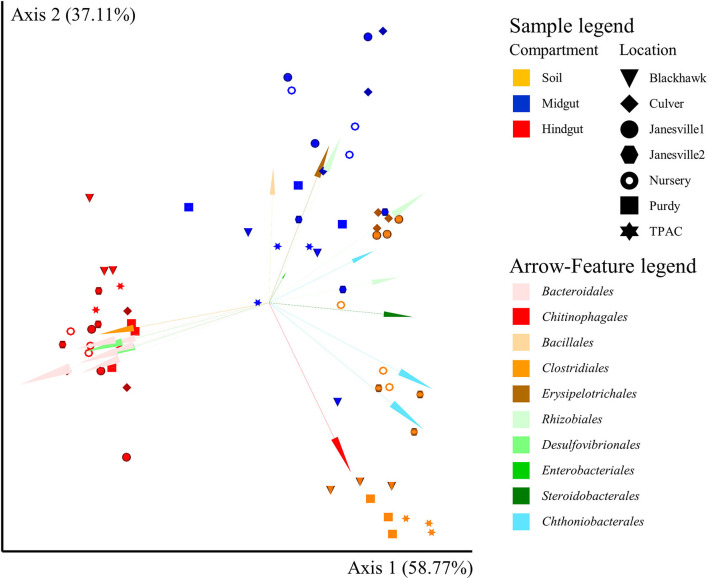
Figure 4.
Compositional principal coordinate analysis (PCoA) biplot portraying beta diversity of prokaryotic communities in midgut and hindgut of third instar Japanese beetle (P. japonica) larvae and associated soil. The PCoA biplot was generated using DEICODE (Robust Aitchison PCA) (Martino et al., 2019) and visualized in Emperor (Vázquez-Baeza et al., 2013). Data points represent individual samples where symbol shape denotes location while symbol color denotes compartment (i.e., midgut, hindgut, or soil). The top 20 taxa driving differences in ordination space at the order rank are illustrated by the arrows. All taxa belong to Bacteria. The phyla within Bacteria are represented by specific hues, where Bacteroidetes (7) = red/pink, Firmicutes (3) = orange/brown, Proteobacteria (7) = green, and Verrucomicrobia (3) = blue. SILVA v132 database (Quast et al., 2012; Glöckner et al., 2017) was used for taxonomic classification.

