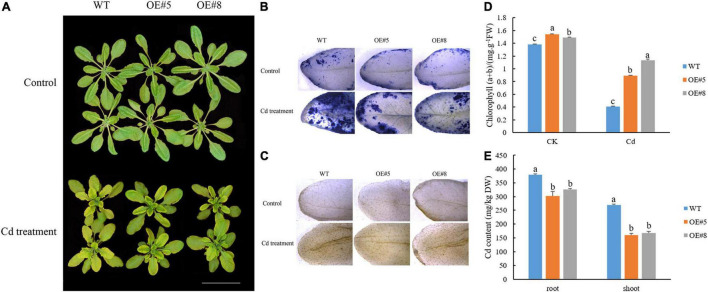
FIGURE 10.
Effects of Cd stress treatments on the growth of SpbZIP60-overexpressing Arabidopsis plants. (A) Phenotypes of SpbZIP60-overexpressing transgenic lines and wild-type (WT) plants under normal conditions or in response to the Cd treatment. Bar = 5 cm. (B) NBT staining results. (C) DAB staining results. (D) Chlorophyll contents of the WT and transgenic lines before and after the Cd treatment. (E) Cd contents of the WT and transgenic lines. Bars represent the mean ± standard deviation (SD) of at least three independent biological replicates. Significant differences according to a one-way analysis of variance are denoted as follows: p < 0.05 (Duncan’s test).

