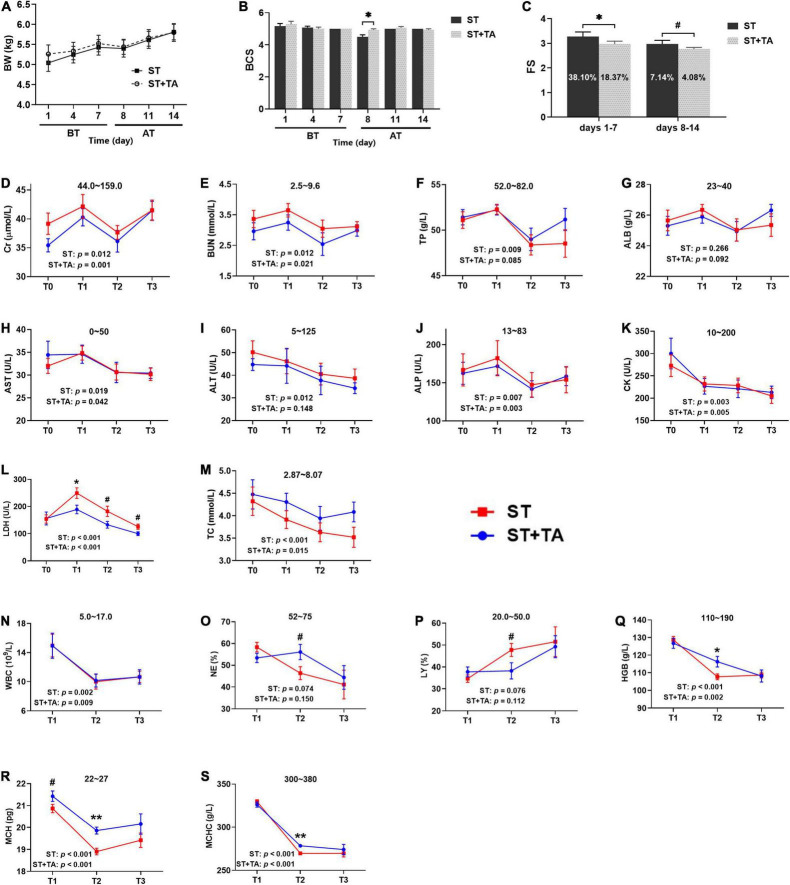
FIGURE 2.
Effect of TA on body condition (A,B), fecal score (FS) (C), serum biochemistry (D–M), and hematology (N–S) in dogs. Data are presented as mean ± standard error (SE) (n = 6 or 7). *p < 0.05 and **p < 0.01 represent the difference calculated by Student’s t-test between the stress (ST) and ST + TA groups; #p < 0.10 represents the difference in tendency calculated by Student’s t-test between the ST and ST + TA groups. The p-values in the figures indicate the difference of each group at T1–T3 calculated by repeated-measure analysis of variance (RM-ANOVA). Numbers in the column chart indicate the diarrhea rate. Numbers at the top of each figure refer to the normal reference ranges for serum biochemistry and hematology indices. BT, before transportation; AT, after transportation; T0, day 1 before transportation; T1, day 7 before transportation; T2, day 8 after transportation; T3, day 14 after transportation. Cr, creatinine; BUN, blood urea nitrogen; TP, total protein; ALB, albumin; AST, aspartate aminotransferase; ALT, alanine aminotransferase; ALP, alkaline phosphatase; CK, creatine kinase; LDH, lactate dehydrogenase; TC, total cholesterol; WBC, white blood cell count; NE, neutrophils; LY, lymphocyte; HGB, hemoglobin; MCH, mean corpuscular hemoglobin; MCHC, mean corpuscular hemoglobin concentration.

